Meta's "True" ROIC, and Some Notes from Meta and Alphabet's 10-Qs
Over the weekend, I realized that the way I was calculating Meta’s ROIC somehow masked its “true” ROIC. So, I updated my process around calculating its ROIC and wanted to share the updated number since it is noticeably different from the one I shared earlier and I think reflects closer to its economic ROIC.
Let’s start with the numerator in ROIC: Net Operating Profit After Tax or NOPAT. To make this number more comparable over a longer time series, I have added back all the one-off expenses over the years e.g. FTC fine in 2019, layoff and restructuring related expenses in 2022, and the most recent legal and severance related costs in 2Q’26. Then I used a normalized tax rate of 21% (instead of actual effective tax) to net out tax variability over time.
The denominator is the Invested Capital. Before I explain how I calculated invested capital, let me first mention that invested capital should include capital that's ACTUALLY deployed AND generating the NOPAT in your numerator. Anything you add to the denominator needs a corresponding adjustment to the numerator, or you're just mechanically depressing ROIC without economic meaning.
So, I started with total assets and subtracted cash and marketable securities, equity investments (this has no impact on NOPAT but it went from zero in 2Q’20 to ~$30 Billion now which would depress ROIC in recent quarters following ScaleAI stake last year if you don’t adjust for it), and non-interest bearing operating liabilities. I used to not net out operating lease liabilities which was an error on my part; if I leave the lease liabilities unsubtracted (keeping ~$24 Billion of Right-Of-Use assets in the capital base) while NOPAT already bears the full lease expense including its embedded financing cost, I would have understated ROIC. Similarly, I didn’t net out “long-term income taxes” before, but since I am already using normalized tax rate than the typically lower effective tax rate for Meta, my numerator already captures such impact and it should be netted out from my invested capital calculation. Perhaps most importantly, I have subtracted “Construction in Progress” or CIP from my invested capital base since this non-depreciable asset by definition is currently generating zero return for the business and hence have no impact on NOPAT. Once this asset becomes “active”, it will transition from CIP to depreciable asset and will have associated NOPAT impact.
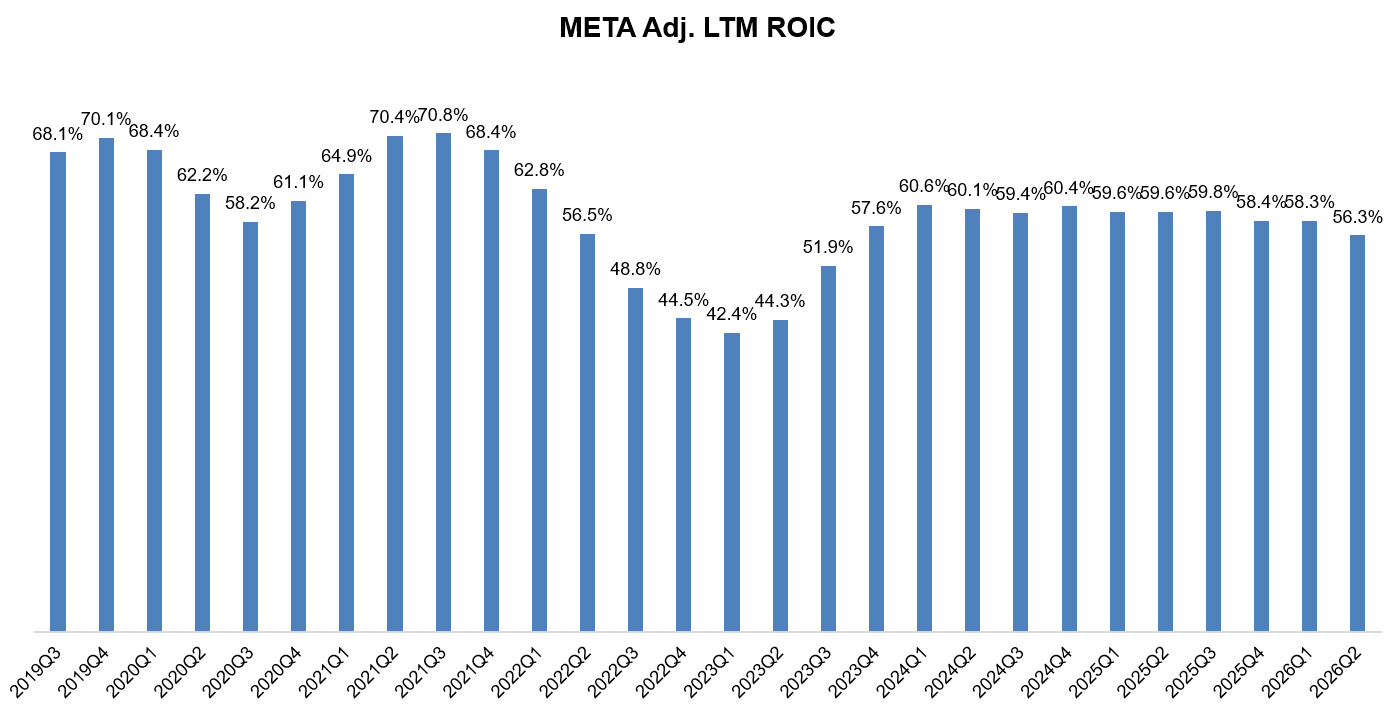
After making all these adjustments, I get to the below LTM ROIC chart for Meta Platforms. While 2Q’26 did see slight downtick in ROIC, it is quite remarkable that companies of this size are actually reporting mid-50s ROIC. But this chart is also why investors are perhaps wary about the capex spree. For context, Meta’s average invested capital in my methodology in 2Q’26 was just ~$127 Billion. CIP in 2Q’26 was a whopping $80 Billion, almost all of which is presumably going to come online in the next 18-24 months. So, the invested capital base is going to go up significantly in the coming years (and the depreciation expenses). As a result, Meta’s LTM ROIC in this methodology will almost certainly keep going down as well. Generally speaking, investors don’t really like it whenever the incremental ROIC is noticeably worse than the overall ROIC. While that is understandable, given the scale of capital deployment investors should be okay with ~20-30% incremental ROIC which would still be lot lower than current “true” ROIC but obviously much, much higher than cost of capital. You can quip that given the incremental ROIC is likely going to be lot worse than current ROIC, shouldn’t the multiple for companies such as Meta go down? That makes intuitive sense, but important to remember the broader context here. One of the big drivers for multiples is reinvestment runway. Even if your ROIC is sky-high and has limited reinvestment runway, your multiple might be lower than a company with respectable ROIC but an immense reinvestment opportunities. This is essentially why Amazon has consistently traded at a materially more premium multiples in the past than either Alphabet or Meta despite having much lower ROIC. Investors were just much more comfortable about Amazon’s reinvestment runway than Google Search or Meta’s FOA business both of which were already outright dominant companies in their lane and investors perennially worried about their limited reinvestment opportunities. Google Cloud was an early indication why such concern may have been premature, but AI is a potential lifeline for a massive reinvestment runway for both Meta and Alphabet, albeit with likely an inferior incremental ROIC than their current “monopolies”. Of course, there is a vigorous and legitimate debate around long-term incremental ROIC of the capex build out for these companies. You can be skeptical about the actual return on the capacity that is about to come online in the next 2-3 years and still acknowledge that so far, the reporting numbers have shown very little deterioration of these businesses’ ROIC (I am just showing Meta’s ROIC here, but the broader message/trend is also very much applicable for Alphabet. Since Alphabet didn’t report “asset not yet in service” line item before 2024, we cannot build a longer term time series chart for their ROIC).
Beyond the persistent ROIC debate, I also want to share some thoughts about Meta and Alphabet after going through their 10-Q behind the paywall.
Subscribers get the daily journal and five+ years of Deep Dives, i.e. full-length analyses with financial models on 65+ companies. The daily is just how I think out loud between the Deep Dives!