Is valuing SaaS stocks a special form of the Petersburg Paradox?
Please subscribe to receive future posts in your inbox.
In the September 1957 issue of The Journal of Finance, David Durant published an essay titled “Growth stocks and the Petersburg paradox”. In his essay, he wondered, “when the growth potential of a stock becomes widely recognized, its price is expected to react favorably and to advance far ahead of stocks lacking growth appeal, so that its price-earnings ratio and dividend yield fall out of line according to conventional standards. Then the choice between growth and lack of growth is no longer obvious, and the astute investor must ask whether the market price correctly discounts the growth potential. Is it possible that the market may, at times, pay too much for growth?”
It's always good to find out it’s not just me that is having a difficult time to make sense of the valuation of some of the growth stocks. It turns out the question is a fairly ancient one, and as you can see, it did confound generations of investors. The mystery of growth stocks even prompted Durant to equate growth stocks to one of the most enduring mysteries of all time: The Petersburg Paradox.
What is the Petersburg Paradox?
In 1738, Daniel Bernoulli presented this probability problem which he attributed to his cousin Nicholoas. In this problem/game, there are two characters: Peter and Paul. Here’s how the game is played: “Peter tosses a coin and continues to do so until it should land ‘heads’ on the very first throw, two ducats (think dollar or any currency) if he gets it on the second, four if on the third, eight if on the fourth, and so on, so that with each additional throw the number of ducats he must pay is doubled.”
To visualize the sequence, look at the below table. One way to think about it is the payment to Paul will be 2^(number of tails in the sequence). If there are just 40 consecutive tails in a sequence, payment to Paul will exceed $1 Trillion.
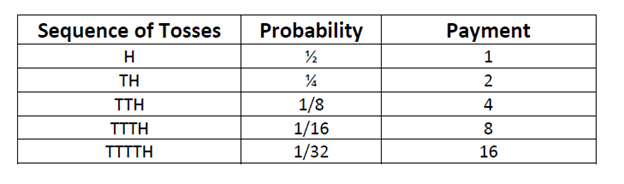
From the above figure, you can infer that Paul’s expectation is the sum of the products of probability by payment or ½+2/4+4/8+8/16+16/32+…
In other words, if there are n terms in this sequence, the sum of the sequence will be n/2. The question is how much Paul should be willing to pay to enter this game.
The theoretical answer is infinite although nobody in real world is willing to bet probably even $10 to enter this game. While choosing not to pay much to enter this game makes an intuitive sense to all of us, the theoretical explanation has eluded statisticians, economists, philosophers, and mathematicians for centuries.
Here’s how John Maynard Keynes explained his aversion to pay much to enter this game,
“We are unwilling to be Paul, partly because we do not believe Peter will pay us if we have good fortune in the tossing, partly because we do not know what we should do with so much money….if we won it, partly because we do not believe we should ever win it, and partly because we do not think it would be a rational act to risk an infinite sum or even a very large sum for an infinitely larger one, whose attainment is infinitely unlikely.”
The pitfalls of using DCF was not lost on Durant, especially for high-growth stocks even in the ‘50s as illustrated in the following quote,
“The moral of all this is that conventional discount formulas do not provide completely reliable evaluations. Presumably they provide very satisfactory approximations for high-grade, short-term bonds and notes. But as quality deteriorates or duration lengthens, the approximations become rougher and With growth stocks, the uncritical use of conventional discount formulas is particularly likely to be hazardous; for, as we have seen, growth stocks represent the ultimate in investments of long duration. Likewise, they seem to represent the ultimate in difficulty of evaluation. The very fact that the Petersburg problem has not yielded a unique and generally acceptable solution to more than 200 years of attack by some of the world’s great intellects suggest, indeed, that the growth-stock problem offers no great hope of a satisfactory solution.”
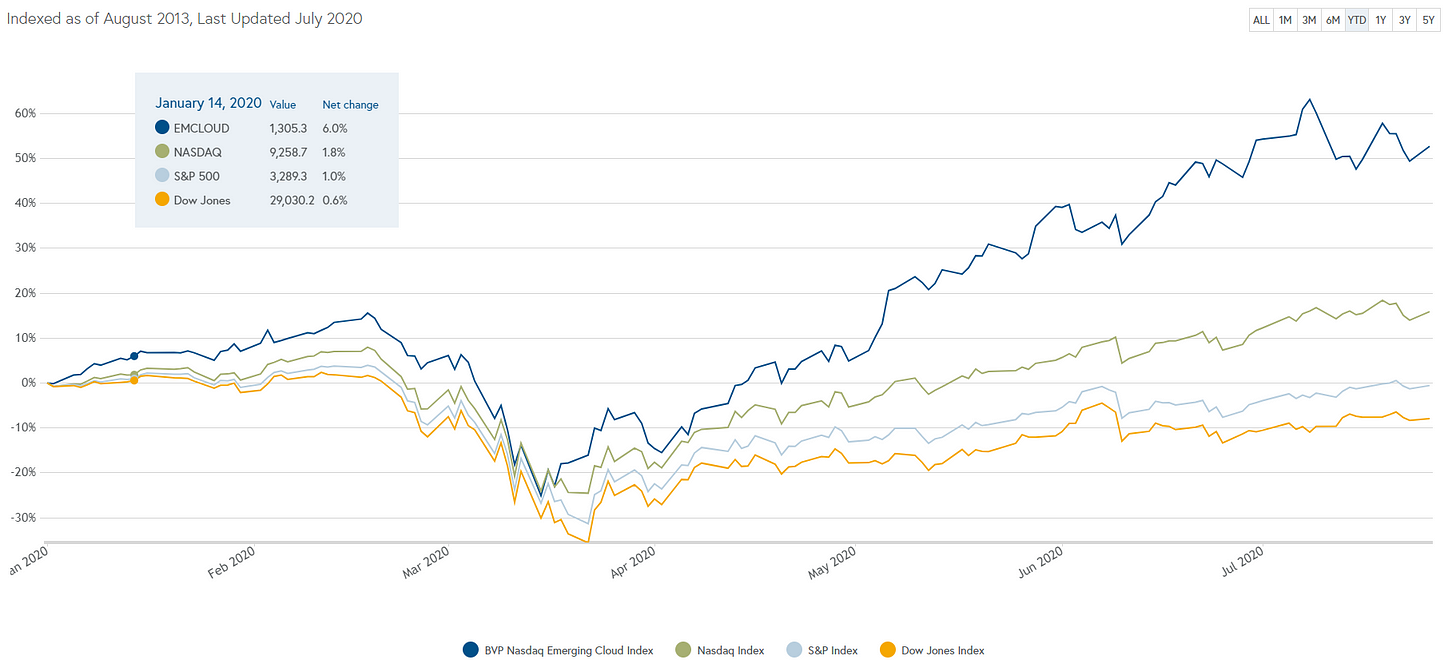
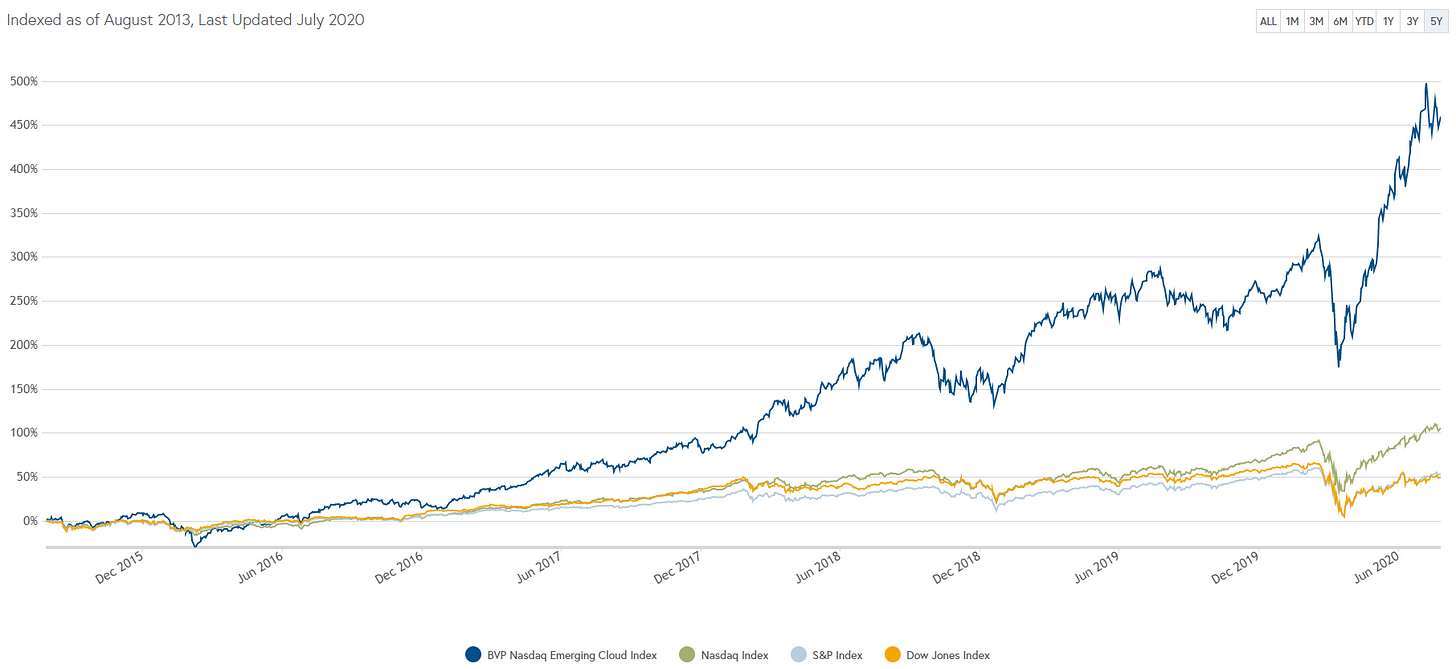
If Durant did not see any great hope for a satisfactory solution for growth stocks back in the ‘50s, imagine the mental state of today’s investors. Bessemer Venture Partners (BVP)’s Emerging Cloud Index (BVPEC) has YTD return of +56%, vastly outperforming NASDAQ (+17.4%), and S&P 500 (+0.3%). The outperformance of BVP Emerging Cloud index becomes even more staggering on last 5-year basis: +763.4%, dwarfing the return of NASDAQ (+190.9%), and S&P 500 (+95.6%).
Of course, return of the stocks is not even half the story and it does not have the power to transmit any indication of whether the stocks are fairly priced or not. While I am in agreement with Durant that DCF or forecasts could prove to be hazardous, I do think expectations investing is a powerful tool many investors do not choose to utilize at their own peril.
BVPEC is currently trading at 17.7x EV/Annualized revenue (mean). LTM FCF margin is 6.9% and revenue growth rate is 35.5% although after adjusting for SBC, FCF will most certainly be no where close to ~7%. Interestingly, the whole BVPEC is above the rule of 40 (margin+ revenue growth >40%). I was curious to see what assumptions we need to hold for BVPEC to generate 10% CAGR return going forward.
Let me make my assumptions explicit here.
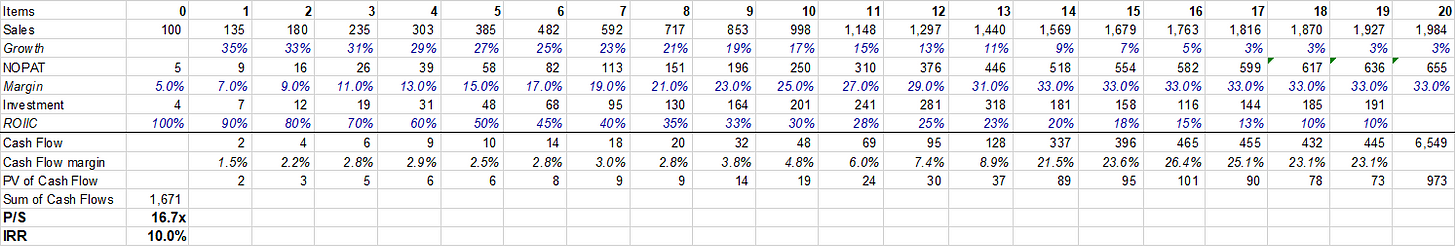
Sales growth: Year 0 sales is $100 and year 1 sales growth is 35%. Growth rate will decelerate by 2% every year going forward until it reaches 3%. Sales growth will remain steady at 3% once it reaches there. For context, BVPEC index constituents’ revenue is currently ~$80 Bn. As per my assumptions, it will reach ~$500 Bn in 2027, ~$1 Trillion in 2031, and ~$1.5 Trillion in 2037 when it will reach its steady state of ~3% topline growth.
NOPAT margin: This is a very tricky assumption. If we look at Income Statement, we might get a false impression as many of these companies leverage income statement to continue to invest in the business. For the sake of simplicity (simple but hopefully not simplistic), let’s assume 5% NOPAT margin in current year which will continue to increase by 200 bps every year going forward until NOPAT margin reaches 33%.
ROIIC: Return on incremental invested capital (ROIIC) is also another tricky assumption but of paramount significance. The initial high ROIIC can be generated through great product market fit, network effects, and perhaps whole host of other factors. As the companies become larger and larger, M&A will most certainly occur, and capital will be invested at much lower ROIC to generate growth. Again, for the sake of simplicity, let’s assume current ROIIC is 100% which will decline by 10% every year i.e. 90% in year 1, 80% in year 2 etc. till year 5. After year 5, ROIIC will decline at 5% per year till year 8, and then ROIIC will decline by 2.5% rate every year until it reaches 10%. BVPEC will continue to generate 10% ROIIC in the steady-state. Cash flow margin increases from 1.5% (not ~7% since I’m assuming cash flow after deducting SBC) in year 1 to ~9% in year 13. As growth slows down and incremental capital requirement commensurately slows, cash flow margin exceeds 20% in out years and settles around 23% in the terminal year.
Under these assumptions, as you can see below, we generate ~10% IRR on BVPEC. You can explore the methodology in more detail here.
If you think my assumptions are absurd, please note that I wasn’t trying to forecast anything. I was just trying to iterate my assumptions to generate ~10% CAGR. It is, however, telling just how much you have to stretch your assumptions to get to ~10% CAGR.
The counterargument to this is obviously in a ZIRP world nobody, even the risky investors, should expect to generate 10% return. You may need a lot less stretched assumptions to generate 5-6% return.
I would urge caution to infer motivated conclusions for individual stocks though. It’s perhaps very likely that a few stocks from these index will still be able to post double-digit CAGR return in the long run despite the lofty initial valuation. For example, you could pay 86.2x sales of Amazon in year 2000, generate 10% CAGR in last 20 years, and still trump S&P 500 by ~400 bps. Of course, the inherent assumption in this example is Amazon is currently fairly valued which may not be the case. We can find other similar examples like Amazon (although perhaps not as “egregious”) but the point is for individual stocks, there can be handful of stocks that can be valued at multiples so high that defies any logic, and still be able to beat the benchmark. The Petersburg Paradox is perhaps indeed the perfect description for such companies. The path dependency and optionality embedded in many of these SaaS or technology stocks may make it a durable mystery for any investor to come up with a valuation method to “value” these businesses.
Thank you for reading.
If you enjoyed this piece, feel free to share. Feedback/counterpoints are always welcome. Please subscribe to receive future posts in your inbox.