Alphabet 3Q’26: Search Worries Weighing In
For the second consecutive quarter, Alphabet posted negative Free Cash Flow (FCF). That wasn’t really a surprise, but investors were jolted by a dilapidated quarter from Search.
For the second consecutive quarter, Alphabet posted negative Free Cash Flow (FCF). That wasn’t really a surprise, but investors were jolted by a dilapidated quarter from Search. At first glance, with 12% search revenue growth you may think Google Search is doing fine? Then take a look at the below chart comparing Meta Family of Apps (FOA) incremental advertising revenue vs Google Search incremental revenue, and you will probably appreciate why investors are…a bit concerned!
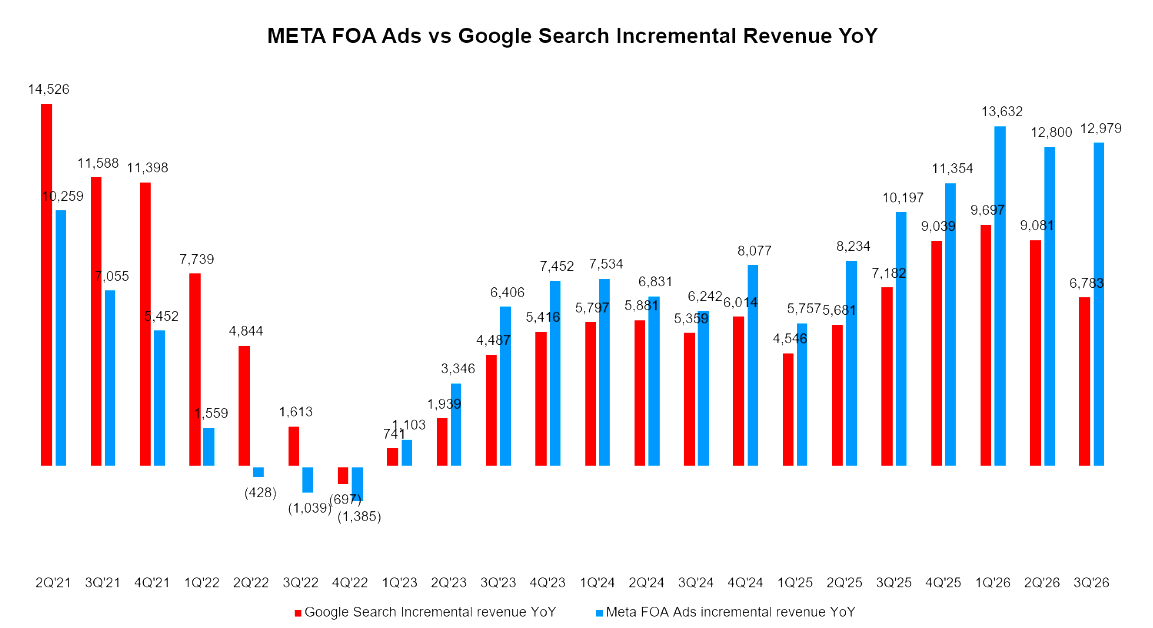
Despite the shabby performance from Google Search, Alphabet’s revenue grew 25% to $127.6 Billion, which puts the company at a half-trillion-dollar annual run-rate and marks the seventh consecutive quarter of accelerating growth, primarily thanks to Google Cloud revenue more than doubling YoY.

Here is the same table in growth terms. Search decelerated from 16.8% to 12.0%, YouTube from 12.9% to 9.2%, and subscriptions from 15.2% to 11.0%, while Cloud went from 82% to 103%. Google Network grew 1.4%, which does not sound like much until you remember it had declined in each of the previous 16 quarters.

Operating income grew 30% as reported to $40.6 Billion for a 31.8% margin, but last year's quarter carried the $3.5 Billion EC fine, and the 10-Q shows this quarter carried a $1.0 Billion charge for two EC Digital Markets Act fines. Excluding one-offs in both periods, operating income grew ~20%, and the incremental margin was 27% rather than the 37% in the table shown below.

Behind the paywall, I will go through each segment, starting with Search: whether management's explanations for the slowdown hold up once you compare them with Meta's quarter and the paid clicks data in the 10-Q. I will also cover Gemini 4, Cloud and TPUs (including a TPU buy-back clause buried in the 10-Q), and then will share some thoughts on the crux of this capex buildout. The spreadsheet behind the ROIC calculation will also be attached for subscribers.
Subscribers get the daily journal and five+ years of Deep Dives, i.e. full-length analyses with financial models on 70+ companies. The daily is just how I think out loud between the Deep Dives!