Sherwin-Williams: Painting the Wonder of Compounding Decade After Decade
You can listen to this Deep Dive here
When much of the Silicon Valley or broader tech world is currently under the spell of the magic of Generative AI or ChatGPT, it may be somewhat monotonous to study a company that was founded in 1866 in Cleveland, Ohio. Some may even wonder it might be more fun to watch paint dry than studying a paint business! Personally, it was, in fact, the opposite. Sherwin Williams is perhaps my favorite Deep Dive in 2022.
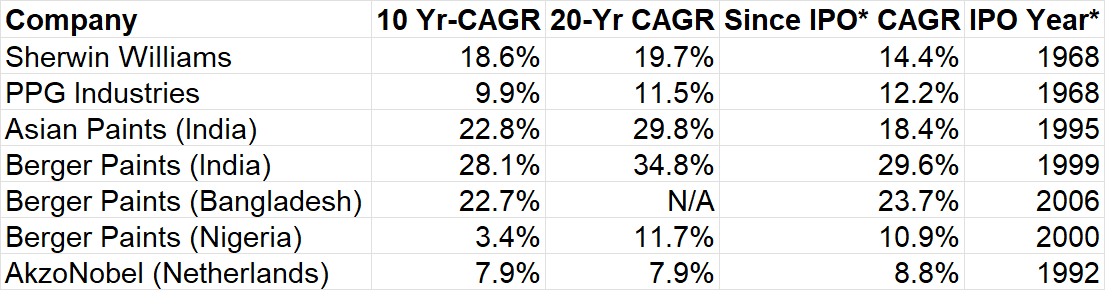
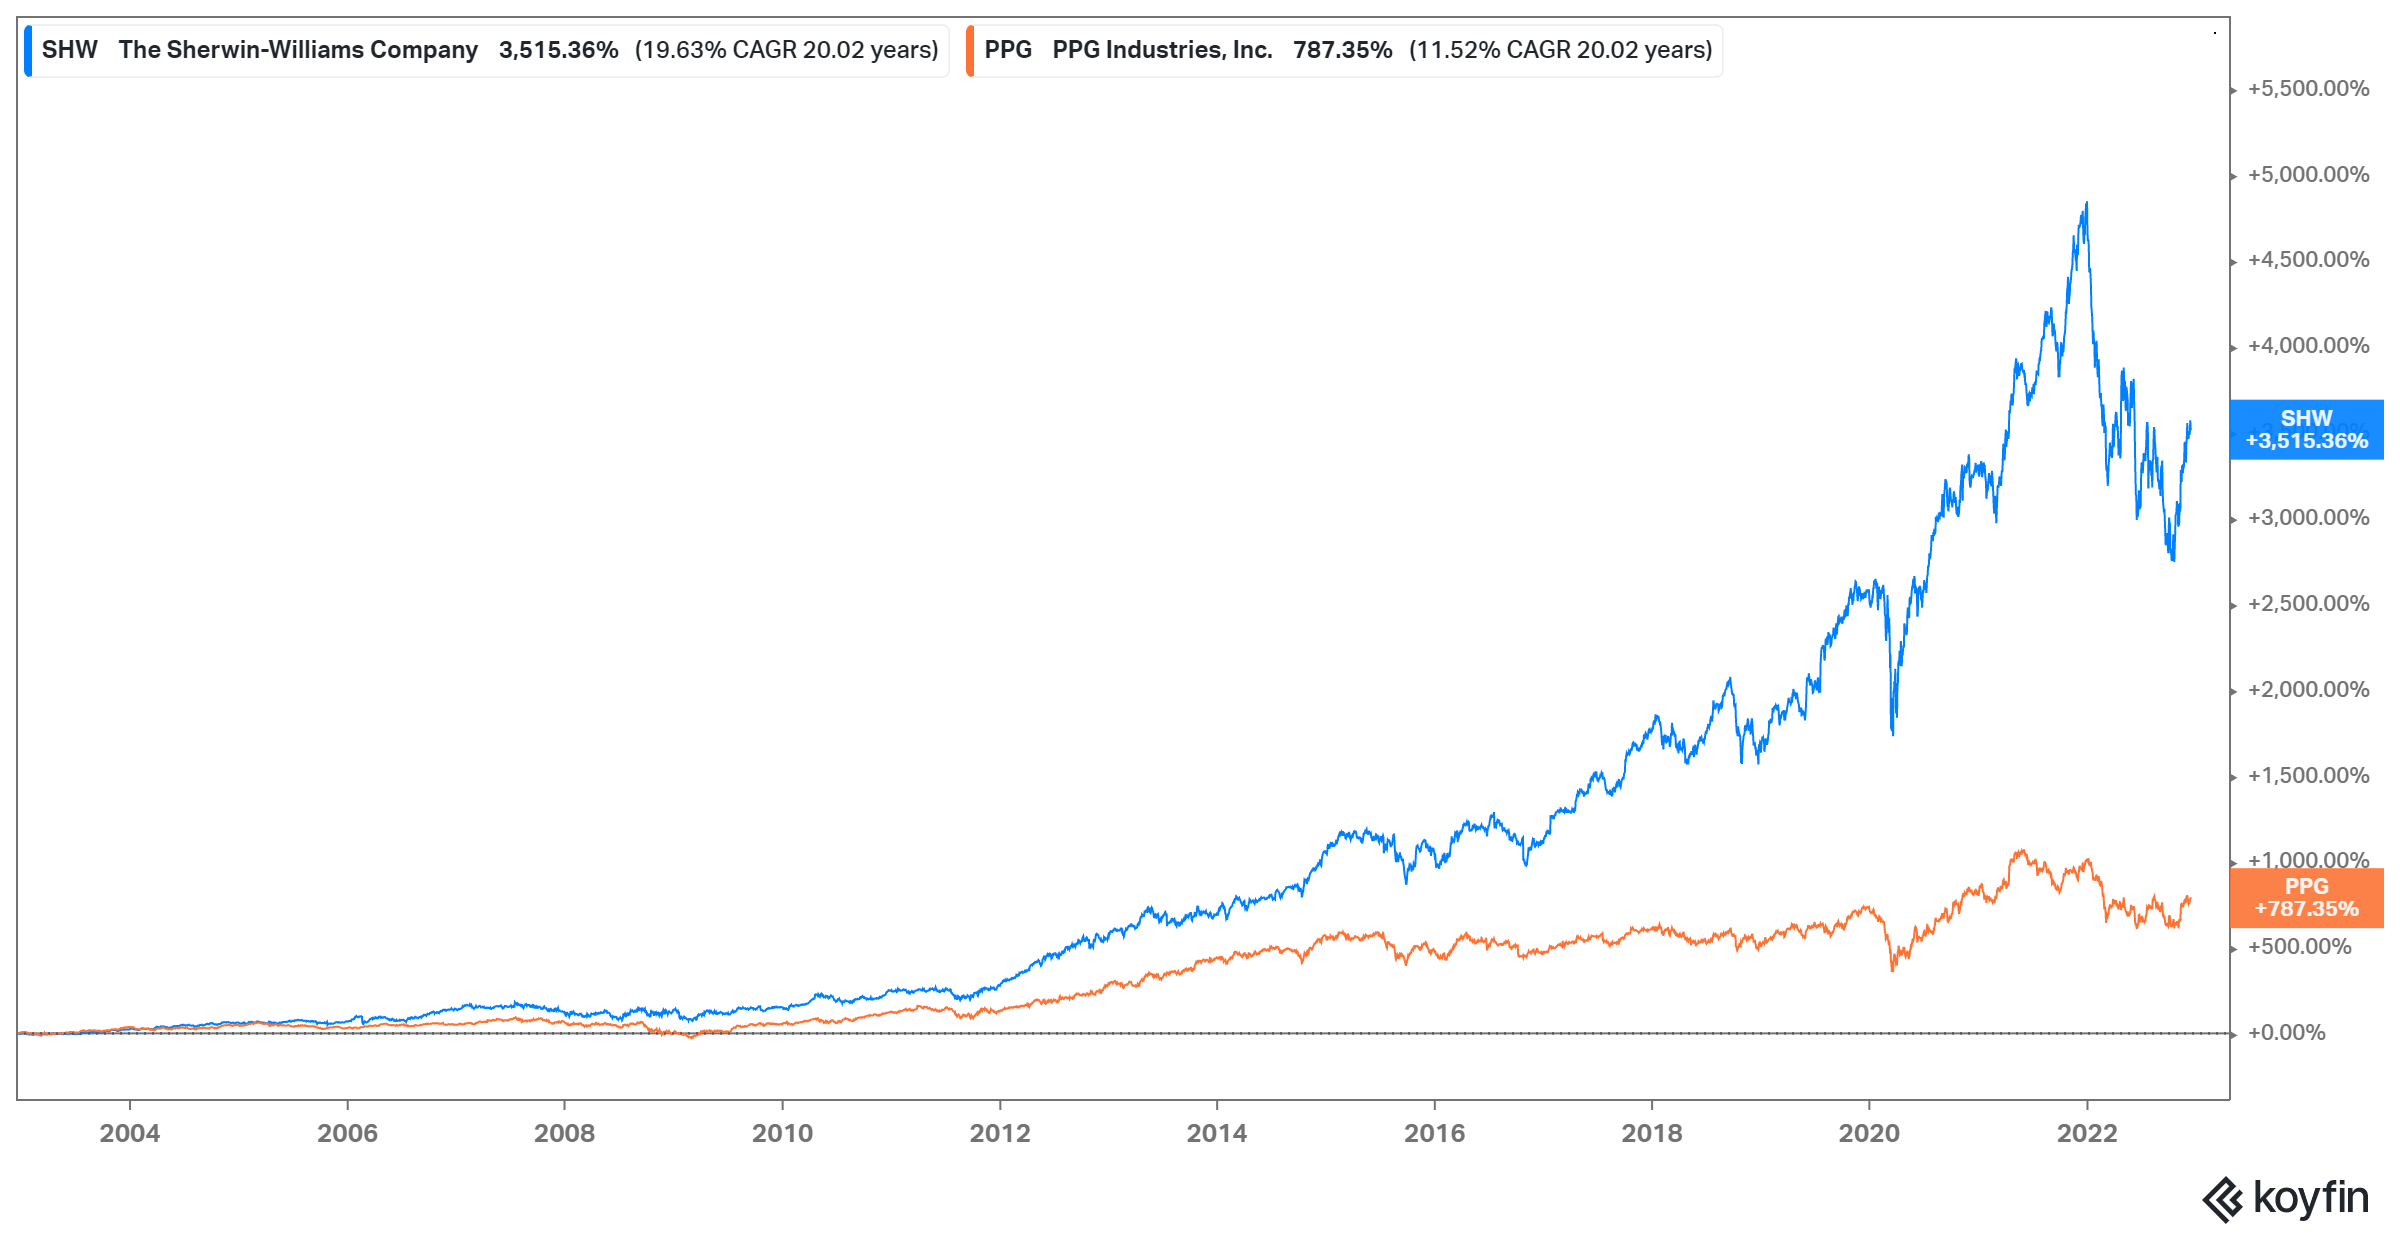
You would probably be surprised how much shareholder wealth was created in the public markets across the world by this "boring" industry. Over the last 20 years, S&P 500 and NASDAQ 100 became ~5x and ~11x respectively. Here's how some of the successful paint companies fared around the world during this timeframe i.e. 20 years:
Sherwin Williams: ~34x or ~20% CAGR
PPG Industries: ~8x or ~12% CAGR
Asian Paints (India): ~182x or ~30% CAGR
Berger Paints (India): ~389x or ~35% CAGR
Berger Paints (Nigeria): ~8x or ~12% CAGR
Basically, most of the players in this industry have outperformed S&P 500 over the last 20 years, some clearly more so than others! For companies to generate massive shareholder wealth, they don't necessarily need to invent airplanes, automobiles, or any mind bending innovation. Sometimes, all it may require is selling products in a consolidated industry that is staple of society.
Of course, there is much more to the Sherwin Williams story and how/why they have compounded over the decades.
Here's the outline for this month's Deep Dive:
Section 1 Sherwin Williams Business Model: Sherwin Williams' three operating segments are dissected in this section. Unit economics of the stores, industry/macro factors, as well as margin structure of each of the operating segments are highlighted here.
Section 2 Competitive Dynamics: While the competitors vary by region, I primarily focused on the rivalry between Sherwin Williams and PPG Industries. While these companies seem to be diverging in strategic direction, I discussed why I think Sherwin Williams is likely making the right decision.
Section 3 Capital Allocation: Even though both PPG and Sherwin Williams generated a lot of shareholder wealth over the decades, I documented how Sherwin Williams' capital allocation strategy helped outperform PPG.
Section 4 Management and Incentives: Sherwin Williams' management and incentive structure is discussed in this section.
Section 5 Valuation and Model Assumptions: Model/implied expectations are discussed here. I also elaborated on my framework for terminal value multiples which is a frequent question I receive from subscribers.
Section 6 Final Words: Concluding remarks on Sherwin Williams, and disclosure of my overall portfolio.
Section 1: Sherwin Williams Business Model
Sherwin Williams reports its business primarily in three operating segments: The Americas Group (TAG), Consumer Brands Group, and Performance Coatings Group. Since TAG is by far the most important segment for Sherwin Williams, let's start with this segment.
The Americas Group
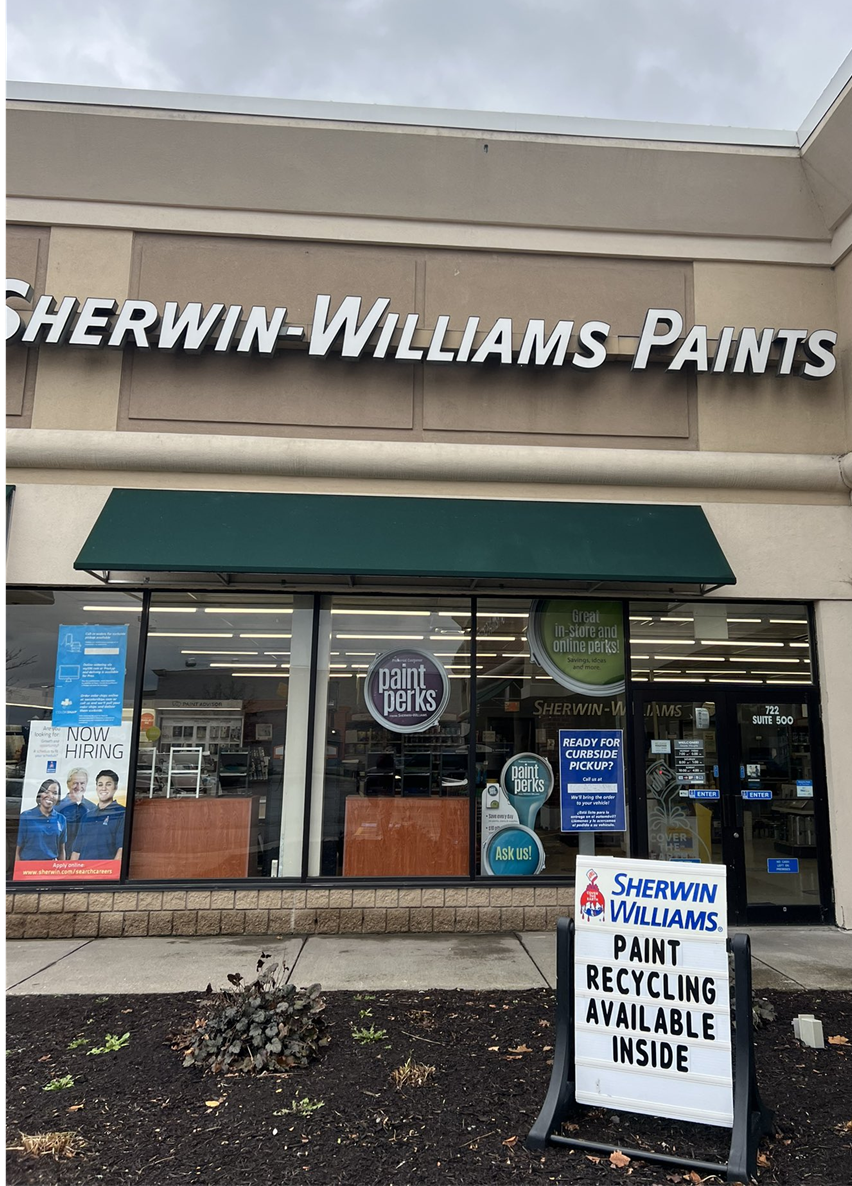
Sherwin Williams has almost 5,000 company operated stores all over the Americas. If you live in the US, you may have visited one of these stores or at least may have noticed it. I visited one such store in Ithaca, NY.
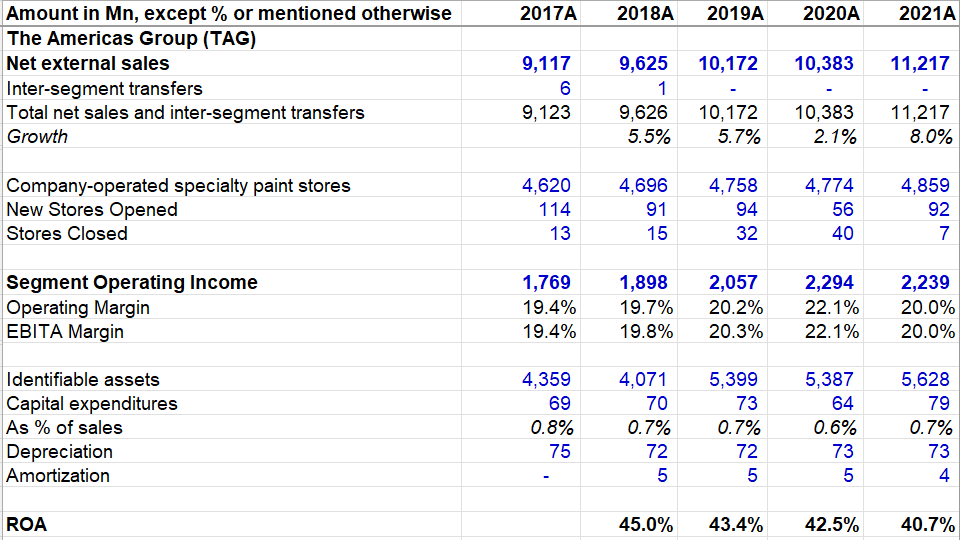
This is a simple business. Some DIY (Do-It-Yourself) homeowners, and mostly industrial and architectural paint contractors visit these stores to buy one of the Sherwin Williams branded paint (please note consumer paint business is generally referred as "architectural" in the industry). While it is a simple business growing mostly at a Mid-Single-Digit (MSD) rate, it is also a ridiculously profitable business.
At first glance, operating margins appear to be fine but not quite extraordinary which has been hovering around ~20% in the last five years; however, you need to look at Return on Assets (ROA) of this segment to appreciate the economics of TAG. ROA for this segment was consistently above 40% in the last five years. Capex intensity is also ridiculously low (0.7% of sales in 2021) which is more or less similar to annual depreciation. So, you have a business with ~40-45% ROA with very little incremental capital required to run and grow the business.
Interestingly, ROA was, in fact, ~75% for TAG in 2016. Following Sherwin Williams' acquisition of Valspar for $8.9 Bn in 2017, Sherwin Williams assigned ~$2.3 Bn goodwill to TAG segment which subsequently led to decline of ROA since identifiable assets increased from $2.1 Bn in 2016 to $4.4 Bn in 2017. Whenever investors come across such astounding ROA or ROIC, the first question that perhaps comes to mind is whether ROIC will mean revert to its cost of capital and at what timeframe this will happen. Maybe never is perhaps an acceptable answer at times.
The reality is ROA of TAG segment is lot lower than ~40-45% when you take into account all the "assets" TAG has. Accounting principles only allow you to report goodwill and other intangibles when you acquire a company and don't let you to estimate or report the intangibles you organically create over time. What is the brand value of Sherwin Williams that it built organically over time? What is the aggregate value of customer relationships and other IPs? If you look at its balance sheet, the answer is zero. But we all know the reality is strikingly different and the value of those intangibles is perhaps in tens of billions. Please note that the last thing I want is to let management estimate the value of their organic intangibles; this isn't a criticism of Accounting principles but more of an explanation why such whopping ROA may continue to sustain because the "actual" ROA, once you adjust for all the intangibles the company has organically created over 156 years, may be lot closer to its cost of equity.
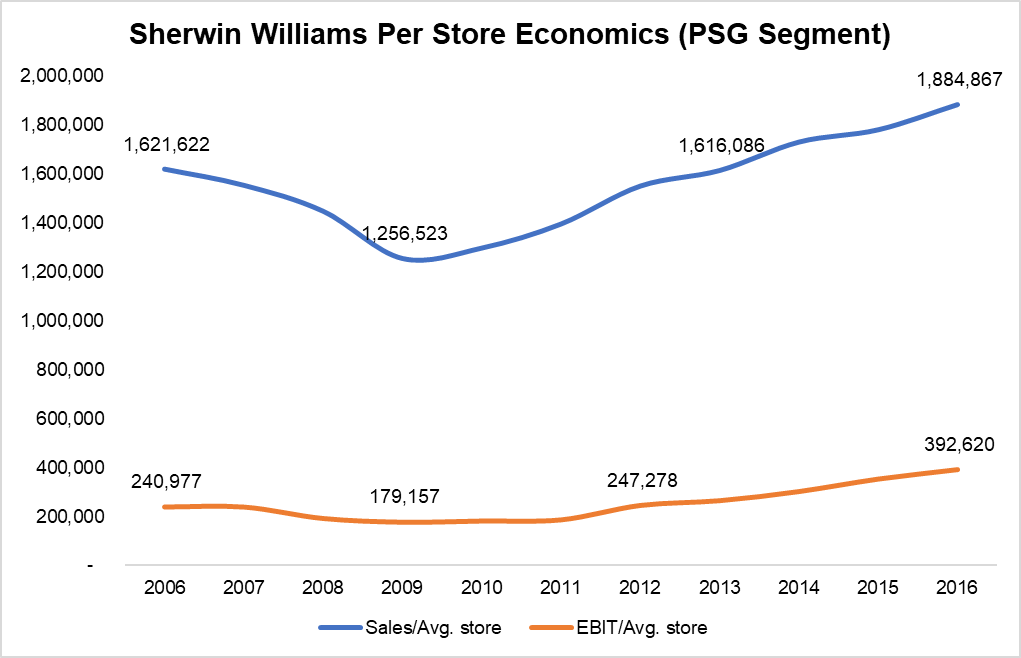
My appreciation for the TAG segment increased substantially once I analyzed store level economics. Let me first focus on TAG's store level economics from 2006 to 2016. 2006 was the prior housing price peak and as you may probably guess, Sherwin Williams' business has a decent correlation with what happens to the housing market (more on this later). During 2006-2016, Sherwin Williams didn't have TAG segment; it used to report Paint Stores Group (PSG) and Latin America Coatings Group separately both of which were later merged together to become the current TAG segment in 2017. PSG segment during 2006-2016 can be compared apple to apple which is why I want to discuss this first and will discuss 2017-2021 later.
PSG segment used to cover just US, Canada, and some Caribbean countries. In 2006, sales per average store was $1.6 Mn/year (calculated as PSG sales divided by number of stores in 2005 and 2006), and the operating profit per average store was $240K/year (calculated as PSG segment profit divided by number of stores in 2005 and 2006). During the depth of housing crisis, sales per store fell to $1.25 Mn in 2009 i.e. ~23% decline from the peak. Similarly, operating profit declined by 26% to $180k per store. It took nearly 7 years to reach the pre-GFC peak sales/store and 6 years to exceed pre-GFC profitability per store. I would like to note that while the business took 6-7 years to get to prior peak, stock fared much better than one might think. SHW stock was flat from January 2006 to March 2009, but by December 2013, stock was almost ~4x (i.e. 21.4% CAGR) from January 2006.
Let's look at what happened from 2012-13 to 2016. While sales per store grew at ~5% rate in 2013-16, EBIT per store increased at a much faster rate of ~14% CAGR during the same time. Here's what I found a bit astonishing. From 2006 to 2016, sales per store increased by ~$260K over the 10 years. But operating profit per store increased by $150k over the same period, implying a whopping 57.6% of the incremental topline growth just falling to operating profit. Paint isn't a software business and hence, it doesn't have ~80-90% gross margin So, how could they do it?
Sherwin Williams doesn't report segment wise gross margin. But its average overall gross margin between 2006 and 2016 was 45.5% (minimum 42.7% in 2011 and max 49.9% in 2016). My sense is PSG's gross margin is perhaps 5-10 percentage points higher than the SHW's overall reported gross margin. But even then, we are essentially saying if $1 incremental sales led to ~$0.576 operating profit in 2006-2016 and it's 50-60% gross margin business, the assumption is operating cost to run these stores wasn't growing much over the years. That is indeed directionally correct, but there are slightly more nuance to that.
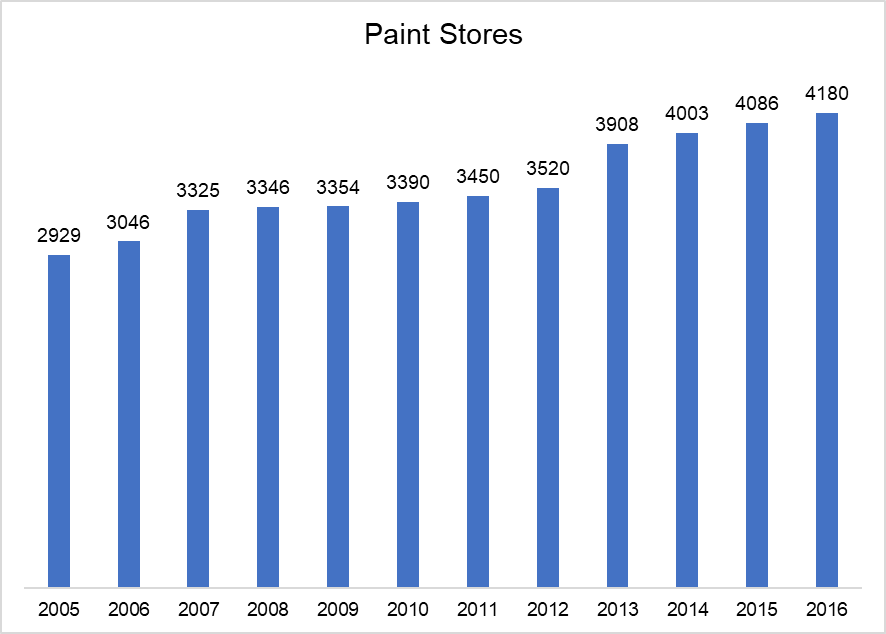
Of course, since this isn't same store sales and profit numbers, my calculation on per store economics cannot be precise. I wondered whether store growth itself may have affected the calculation for per store economics. That doesn't quite seem to be the case as number of stores grew somewhat steadily in 2006-16 except for 2013 as SHW acquired Comex in November 2012.
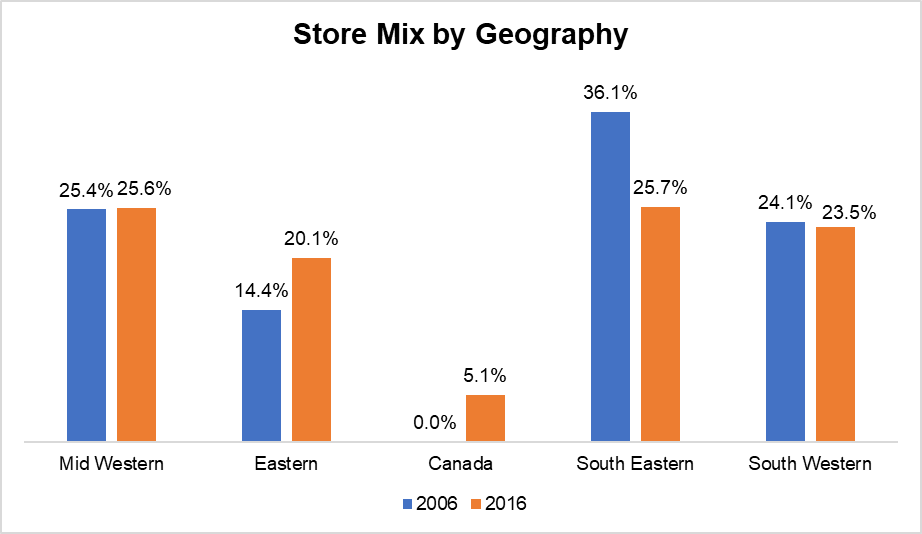
One other reason my calculation of incremental profitability could be overly optimistic is how the store mix itself evolved over time. PSG segment used to be divided in five divisions based on geographical regions: Mid Western, Eastern, Canada, South Eastern, and South Western. From 2006 to 2016, Eastern division+ Canada's presence in the overall store mix increased by ~10 percentage points whereas South Eastern's contribution declined by 10 percentage points.
While I am being a little nitpicky, I want to discourage readers to expect $0.5-0.6 operating profit for incremental $1 sales and I want to mention these various factors that may have contributed to such astonishing results between 2006-2016 per store economics. Nonetheless, I do want to drive the point home that the overwhelming conclusion still is the incremental profitability can be quite lucrative compared to what you may see in reported margins. While ~50-60% incremental margins are unlikely to repeat, ~30-40% incremental operating margins certainly can be in the realm of the possibility, especially in a housing recovery cycle.
To appreciate the incremental profitability for these stores, we need to understand the opex in this segment per store basis. If we assume PSG's gross margin was 5 percentage points higher than overall reported gross margin, PSG's gross margin would be 54.9% in 2016. Assuming 54.9% gross margin, opex per average store was $457,455 in 2016.
Overall, I think the opex per store is almost equally divided in three buckets: a) annual lease, b) fixed salaried employees, and c) hourly salaried employees, delivery expenses and other miscellaneous expenses. While the first two are relatively fixed, hourly salaried employees expense can be somewhat managed depending on the cycle of the industry.
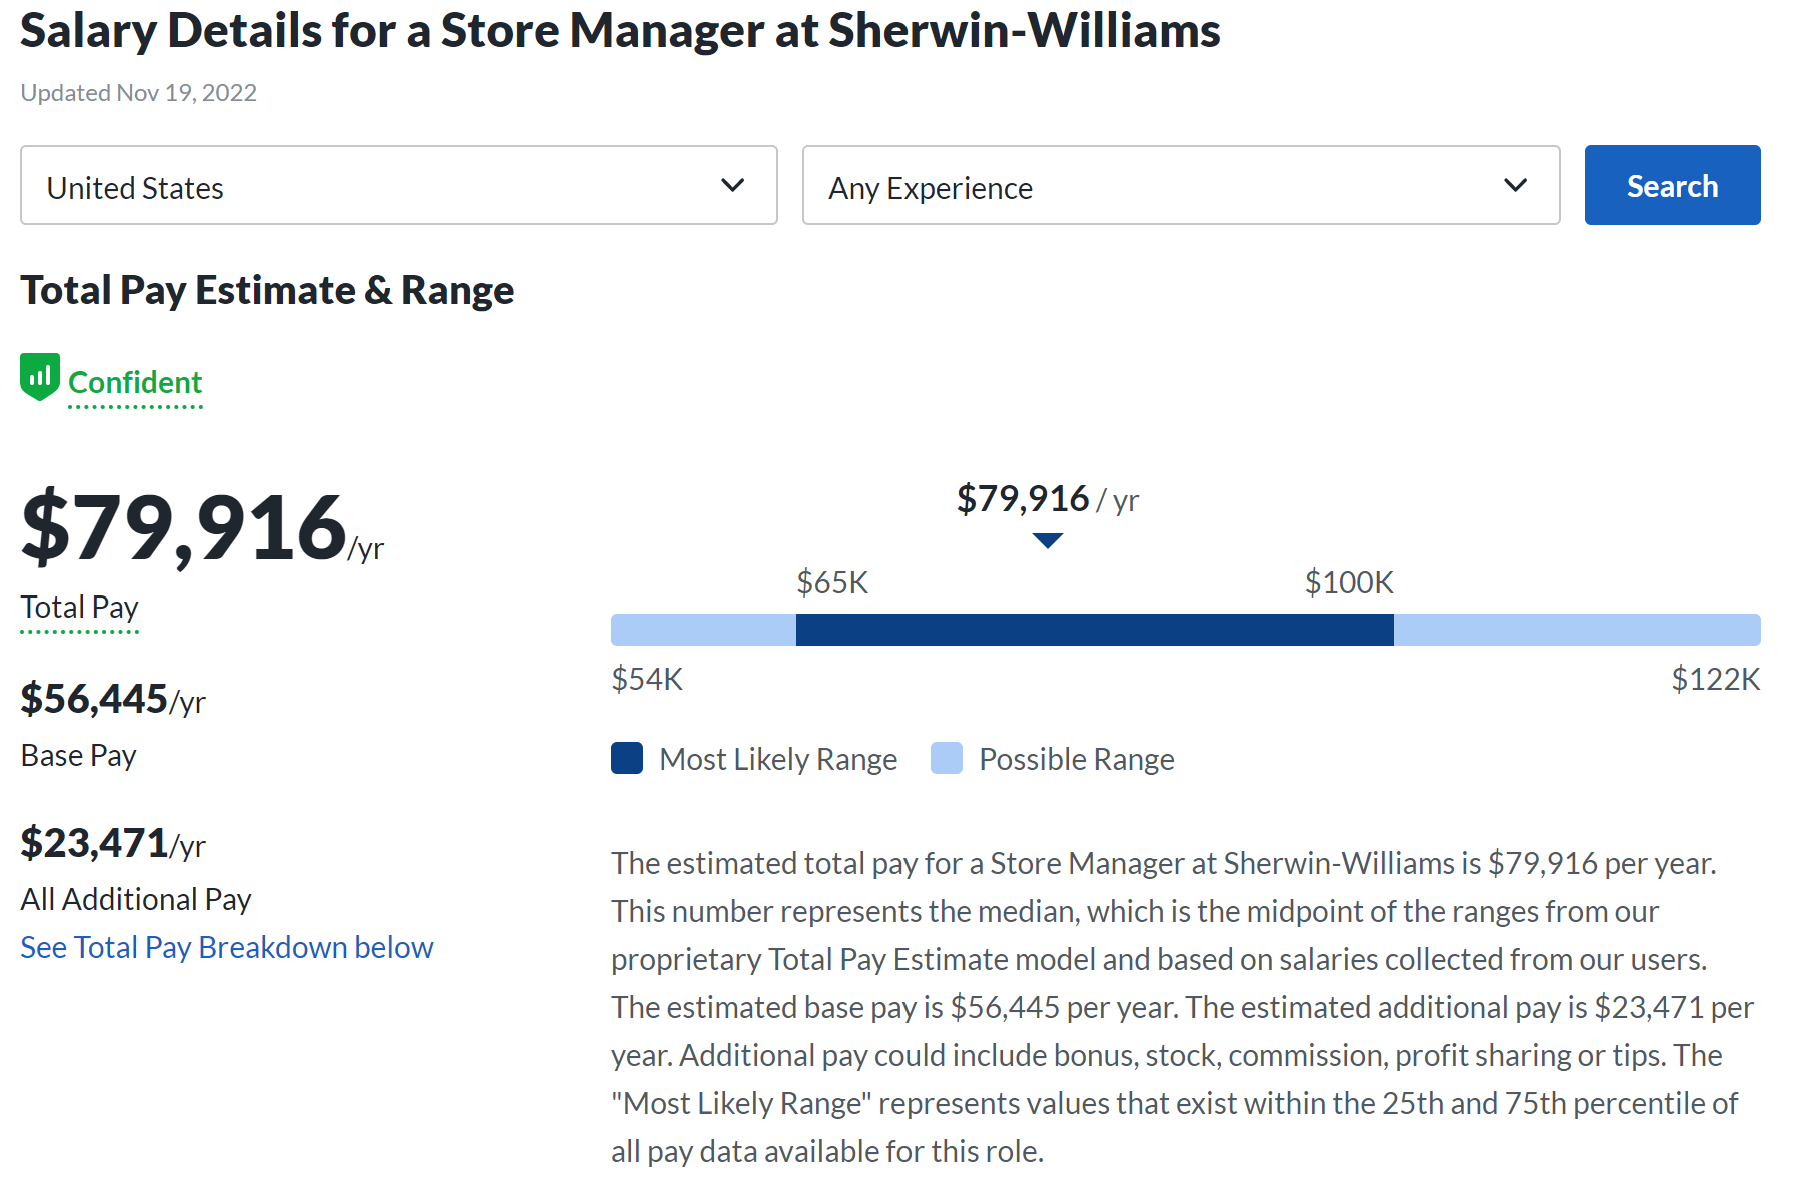
When I visited my local Sherwin Williams Store, I chatted with the Assistant Store Manager who used to be Store Manager at McDonalds but decided to join as Assistant Store Manager at Sherwin Williams. She mentioned they have two full-time employees to manage the store (one Store Manager, and one Assistant Store Manager). Glassdoor indicates an average Sherwin Williams Store Manager makes $80K per year. Assuming the average Assistant makes ~$60-70K/year, the fixed salaries expenses per store is $150K/year. Keep in mind an average store makes ~$1.2-1.4 Mn gross profit today with this fixed salary base which is perhaps lower than an entry level SWE's first-year comp. Beyond this fixed salary, there are variable wages. The assistant manager mentioned their store has four more employees who are paid on an hourly basis (more on this later).
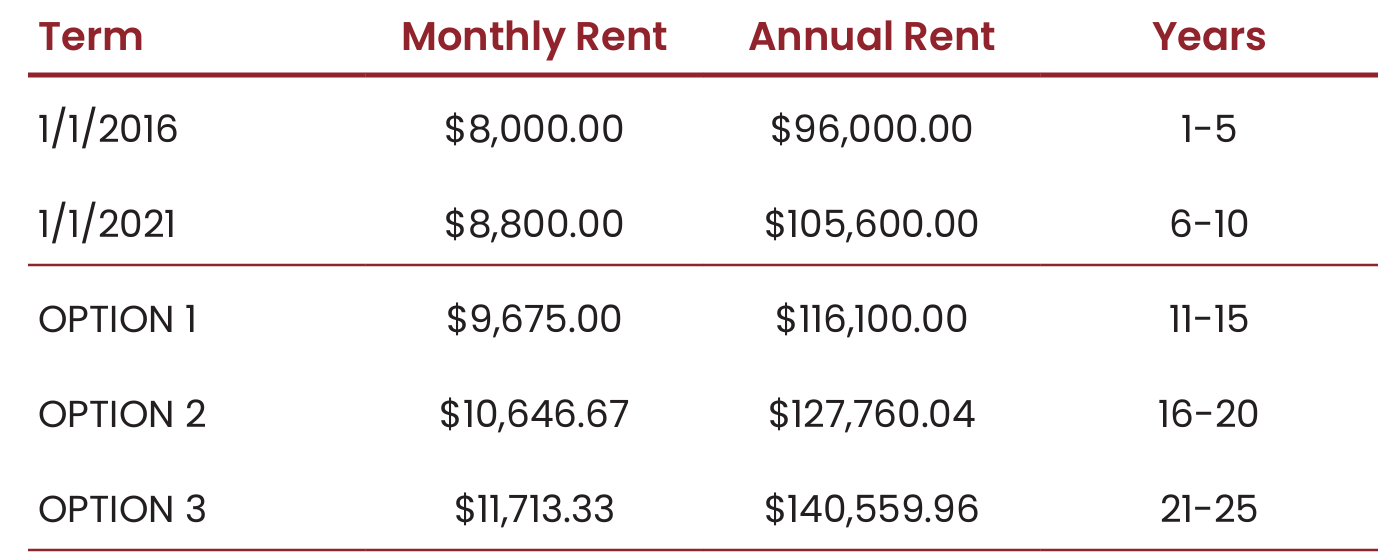
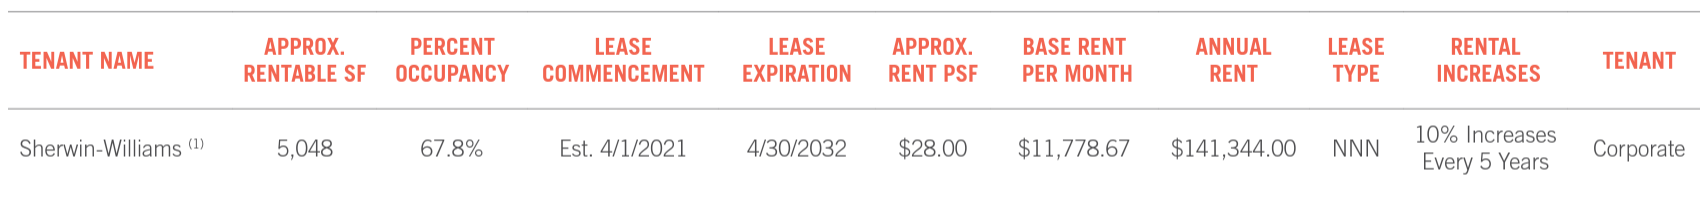
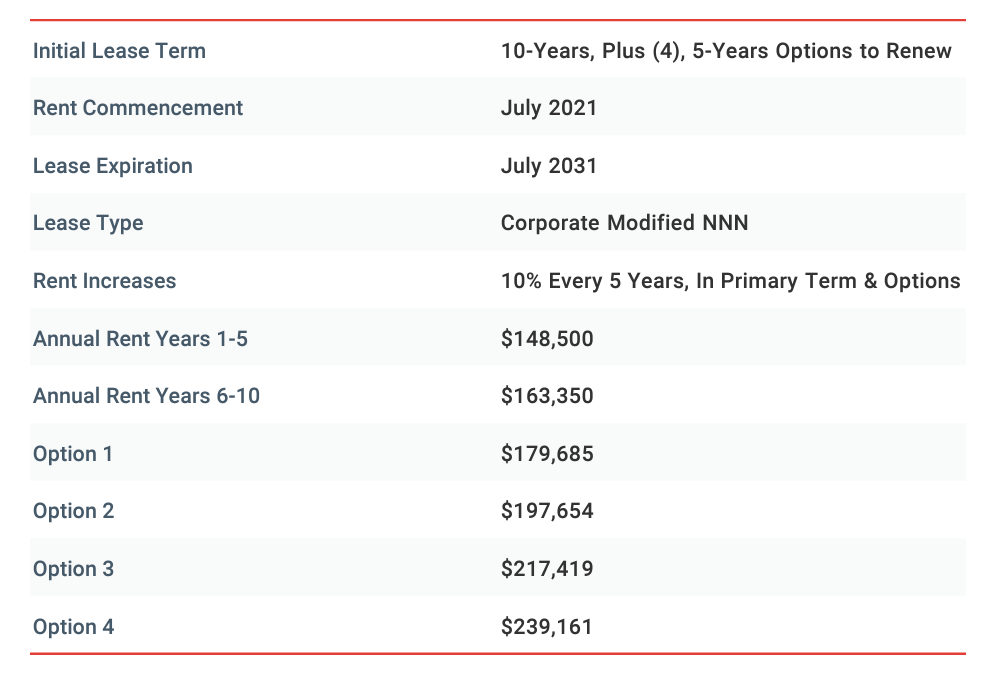
The other major expense bucket is lease expense for the stores. In 2021, there were 4,859 Sherwin Williams store, of which only 217 were owned by Sherwin Williams and the rest were leased. Obviously the lease expense can vary a lot based on numerous factors (size, location etc.). When I googled some publicly available lease documents for some of these stores, I noticed an interesting pattern. I have looked at three lease documents in places such as Lakewood (Washington), Lawrence (Kansas), and Tucson (Arizona). While the lease varied from $100-150K per year, in each case the lease documents indicate rent could only increase by 10% in every 5 years with tenant i.e. SHW having the option to extend these leases with similar terms (i.e. 10% increase in every 5 years) for another 10-25 years after the expiry of initial lease. 10% increase every 5 years implies 1.9% CAGR, so as long as topline grows faster than that, you may see operating leverage over time. If we face deflation in the long term, Sherwin Williams can choose to expire the option and re-negotiate the lease terms with the landlord. On the other hand, if inflation is lot higher than 2%, Sherwin Williams has likely already locked itself at <2% rent increases for the next decade or two and hence can grow its operating income much faster than its topline.
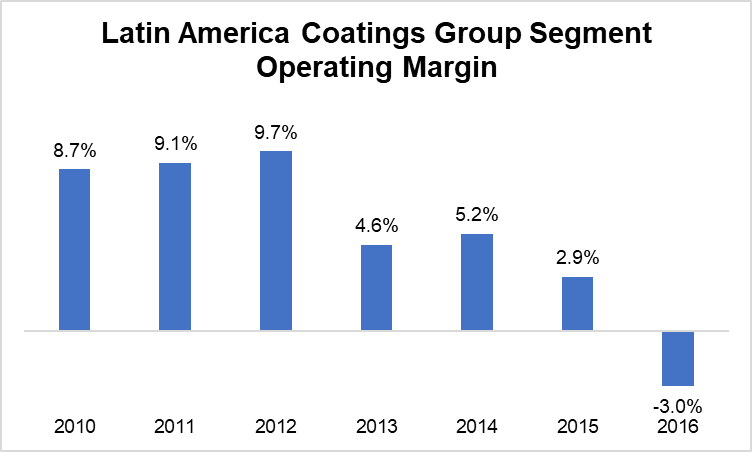
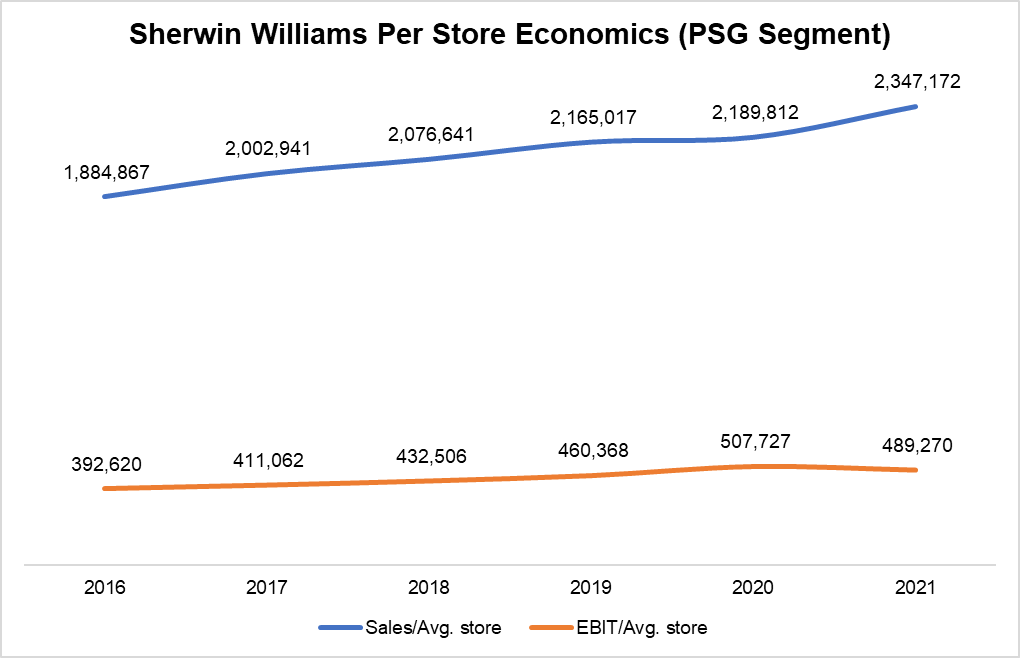
Now that I have discussed 2006-16 period, let's get back to more recent history of this segment: 2017-2021. As mentioned earlier, Sherwin Williams started reporting TAG segment in 2017 which used to be two different segments earlier: Paint Stores Group (PSG), and Latin America Coatings Group. I made some adjustments to make the comparisons apple-to-apple with earlier years. Let me explain these adjustments first. In 2016, Latin America Coatings Group generated $1.86 Mn sales per store. If we assume sales per store grew by 2% in 2017-2021, we can estimate Latin America Coatings Group sales in each year. Then I assumed Latin America Coatings Group to have 5% operating margin in 2017-2021 and the rest of the TAG operating profit were attributed to PSG. Why 5%? We do know Latin America Coatings Group's operating margin from 2010-16 period. During this period, operating margin gradually declined from ~8-10% in 2010-12 to negative 3% in 2016 (the last year we have operating margin for this segment). 5% operating margin in 2017-2021 seems to be fair assumption although it is obviously likely to be volatile year to year.
After making those adjustments, we see sales/average store continued to rise by MSD CAGR, but incremental operating margin of ~60% that we have seen in 2006-16 no longer existed. Sales/average store increased by $462K in 2021 from 2016 whereas operating profit/average store increased by ~$97K, implying ~21% incremental operating margin during this period. Why did incremental operating margin go down significantly from ~50-60% in 2006-16 to ~20% in 2016-2021? 2021 numbers are affected by supply chain issues, so it may not be reflective of TAG's current economics. For example, sales/average store increased by $305K in 2020 from 2016 vs operating profit increase of $115K in 2020 from 2016, implying ~38% incremental operating margin. Overall reported gross margin for SHW declined from 47.3% in 2020 to 42.8% in 2021, indicating the decline in operating profit/store was primarily driven by gross margin. Considering normalized gross margin over the course of the cycle is likely to be ~45-48%, incremental operating margin of ~30-40% may still be possible going forward. However, labor is currently tight, even at the low to mid level. Moreover, as online ordering has increased over time (the assistant manager I spoke with also confirmed the rise of online order), more hourly labor may be required to deliver to customers' home/job sites which may mean lower incremental operating margin in the future vs ~50-60% in 2006-16 period.
Consumer Brand Group
In this segment, Sherwin Williams sells its branded and private label paints and related products through third-party retailers such as Lowe's. However, the brands that retailers such as Lowe's sells may not be available on Sherwin Williams operated stores. For example, even though Sherwin Williams acquired Valspar in 2017, Valspar branded paints are only available on third party retailers. Unlike TAG, this segment has a middleman between Sherwin Williams and the end consumers and hence, they essentially have to sell the product "twice":
We think about our business as if we have to sell every gallon, every paint brush, every can of stain, every single product twice.
If you see the list of third party retailers which sell Sherwin Williams brands in their stores, there is one glaring name missing: Home Depot. Home Depot indeed doesn't sell Sherwin Williams brands, and has partnership with competing companies such as PPG and Behr.
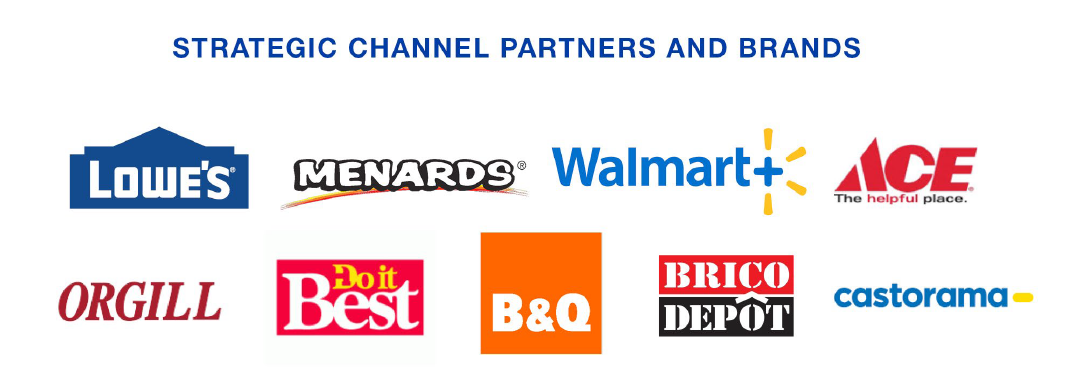
But why does Sherwin Williams sell its brands via third party retailers instead of selling exclusively via its own operated stores? Large home improvement retailers such as Lowe's receive massive foot traffic from DIY customers in their ~2,000 stores across America. While professional contractors are more likely to visit a Sherwin Williams store to buy their paints, DIY customers are much more likely to visit these national retailers.
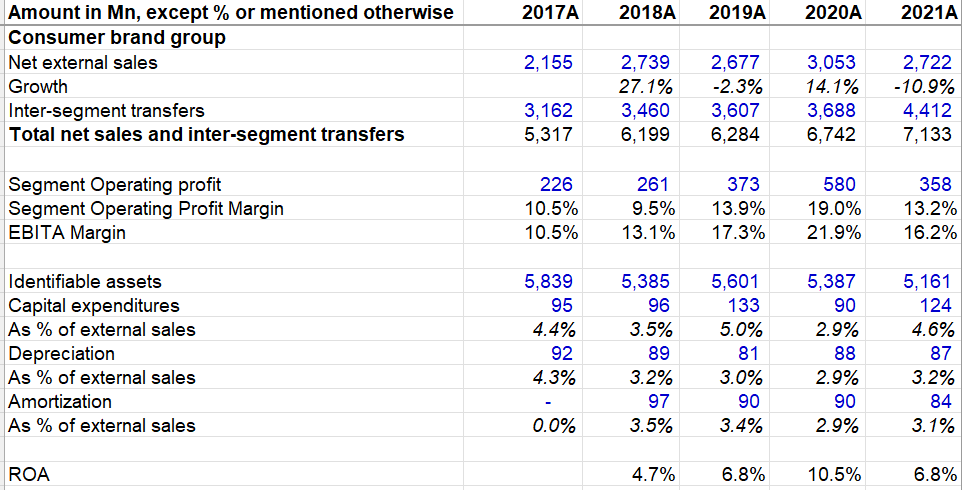
I visited my local Lowe's and asked the Lowe's sales person what differentiates the paints Lowe's has vs the ones I can find on Sherwin Williams stores. He mentioned about different brands (as I just discussed) and typically lower price point at Lowe's at similar quality (but different brands). Of course, a Lowe's salesperson would say lower price point at similar quality brands, but there is some truth to it. DIY customers are likely to be more price sensitive than pro customers. My broader takeaway was this segment's gross margins are likely to be considerably lower than Sherwin Williams' reported gross margin for overall company. Not only do they have to share economics with a third-party retailer but also the brands themselves are likely to be lower gross margin products given lower price points. However, given opex for this segment is likely to be lower, operating margins can be mostly in the vicinity of TAG segment even though operating margins tend to be much more volatile for this segment compared to TAG. Considering the volatility of margins, even if they are similar margin business over the very long-term, I consider this segment to be relatively lower quality business. This segment's EBITA margin went from 10.5% in 2017 to 21.9% in 2020 but then came back to 16.2% in 2021. In contrast, TAG's EBITA margin hovered between 19% to 22% in the last five years. Moreover, considering the power of retailers such as Lowe's, it is perhaps lot better to control your own destiny than negotiating margin with a distributor with massive negotiating leverage.
Please note 62% of this segment's 2021 sales was just intersegment transfer of products primarily sold through TAG. ROA for this segment was MSD to HSD in the last five years. Painting manufacturing and distribution facilities (58 and 31 respectively in Consumer Brands Group) are considered as part of assets of CBG which weighs on CBG's ROA. Moreover, Goodwill and intangibles are material part of its identifiable assets which likely puts a downward pressure on its ROA as well, but incremental ROIC should be lot higher than reported ROA. Consumer Brand segment's operating profit was only 16% of overall company's operating profit.
Now that we have a good idea about Sherwin Williams' architectural paint business, I want to discuss some broader macro and industry factors before moving onto Sherwin William's third operating segment.
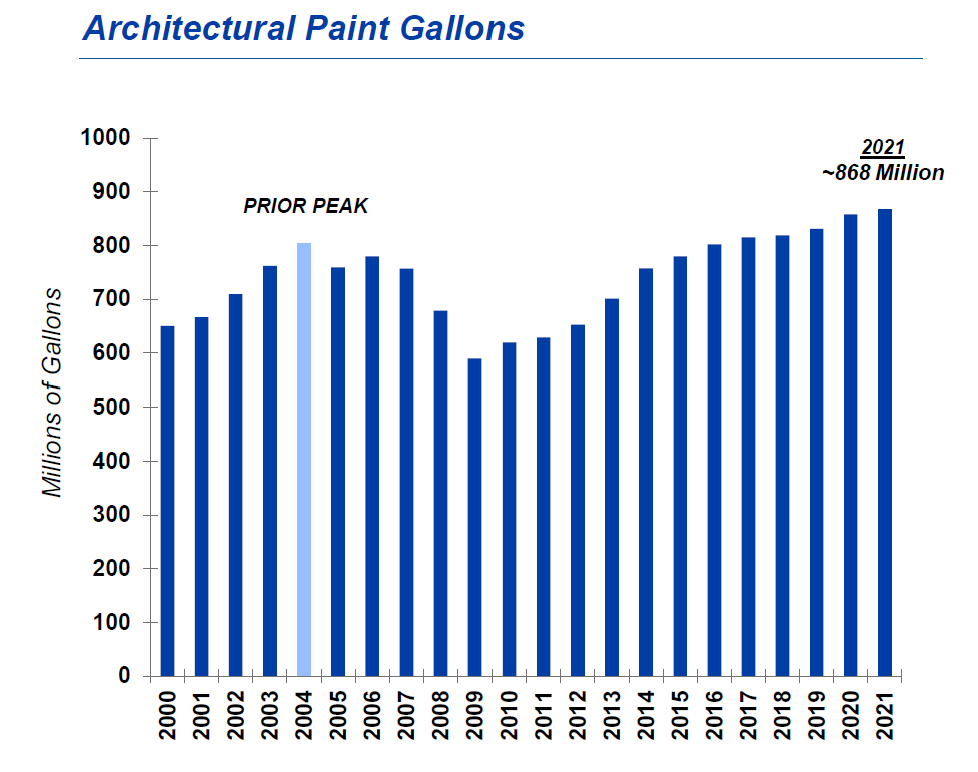
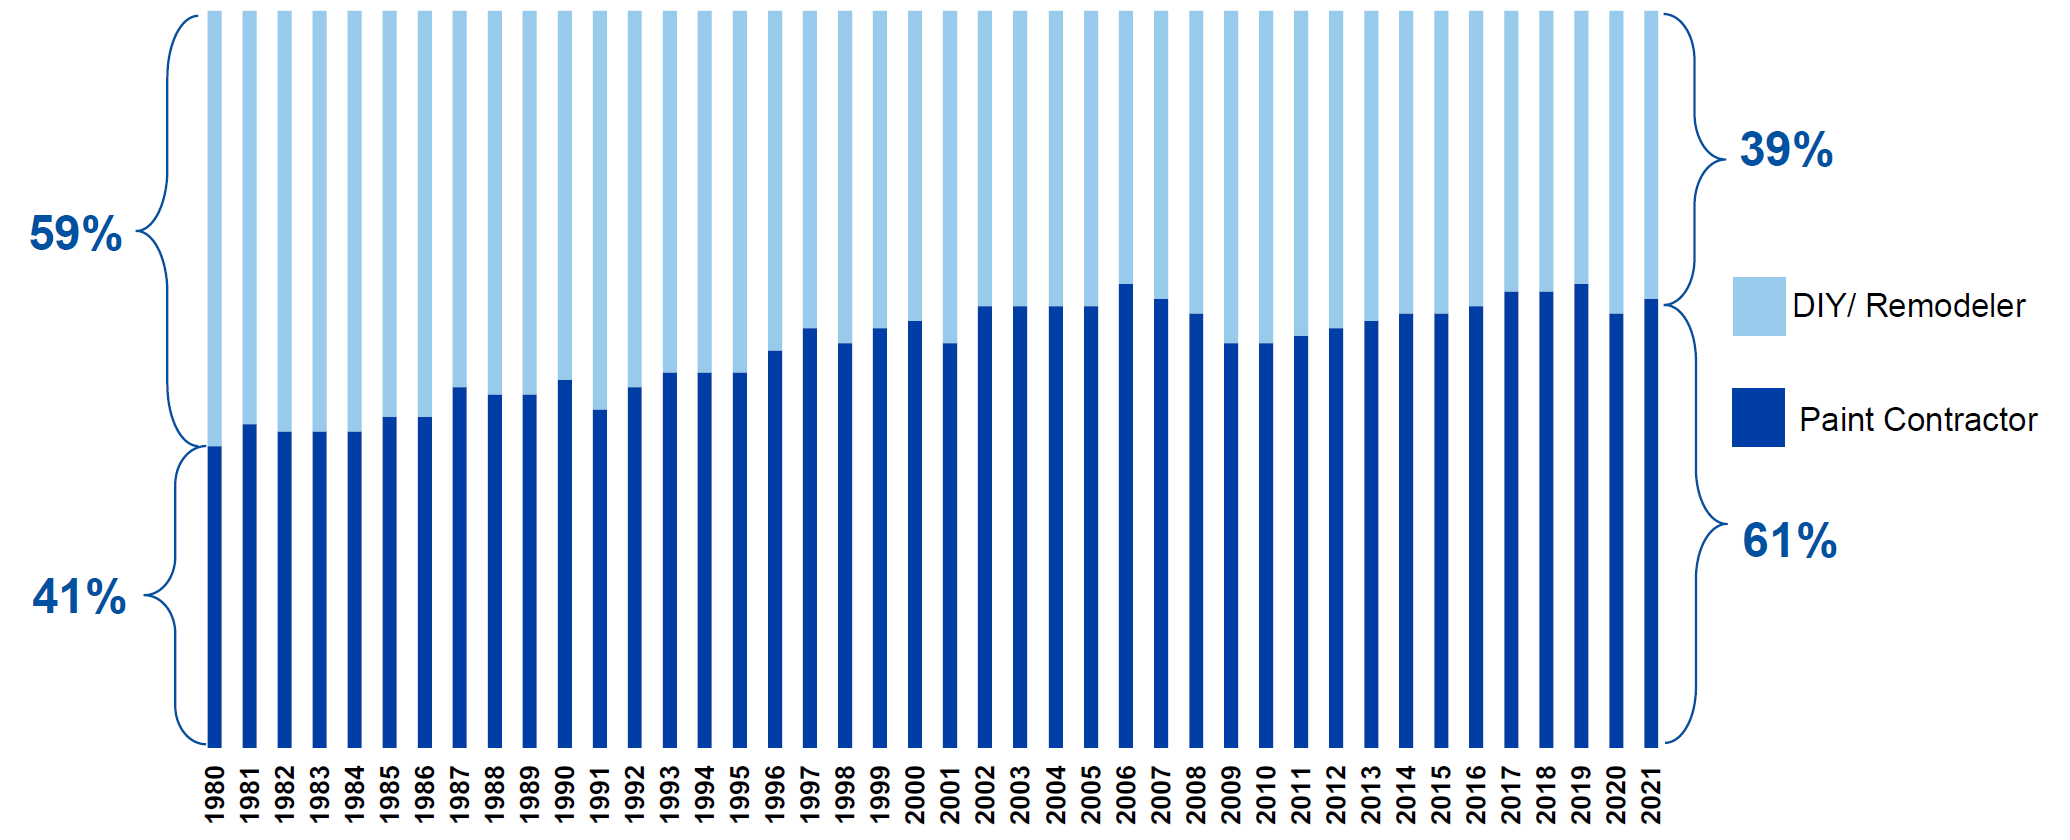
In the most recent Investor Day, Sherwin Williams mentioned their estimate for U.S. architectural paint volume was 868 million gallons in 2021 which implied ~0.5% volume growth from the prior paint demand peak in 2004. Demand for the volume of architectural paint in the US went down from ~800 Mn in 2004 to below 600 Mn in 2009, a ~30% decline from peak to trough over five years. From the bottom, volume growth was ~3.5% CAGR in 2009-2021. Of the 868 Mn gallon volume demand, Sherwin Williams estimated the demand breakdown to be the following: DIY (39%), Pro Residential Repaint (32%), Property Management (12%), New Residential (12%), and Commercial (5%).
The demand breakdown should elucidate why it is of paramount importance to sell through third party retailers which enjoy massive foot traffic from DIY customers. While DIY segment saw a resurgence post-Covid due to shortage of labor as well as increased interest by DIY customers, it is the Pro segment that increased overall market share from 41% in 1980 to 61% in 2021. Therefore, it is entirely possible that over the next 20-30 years, DIY segment will continue to lose share to Pro segment. This is likely to be good news for Sherwin Williams as Pros tend to go directly to their stores for their painting needs.
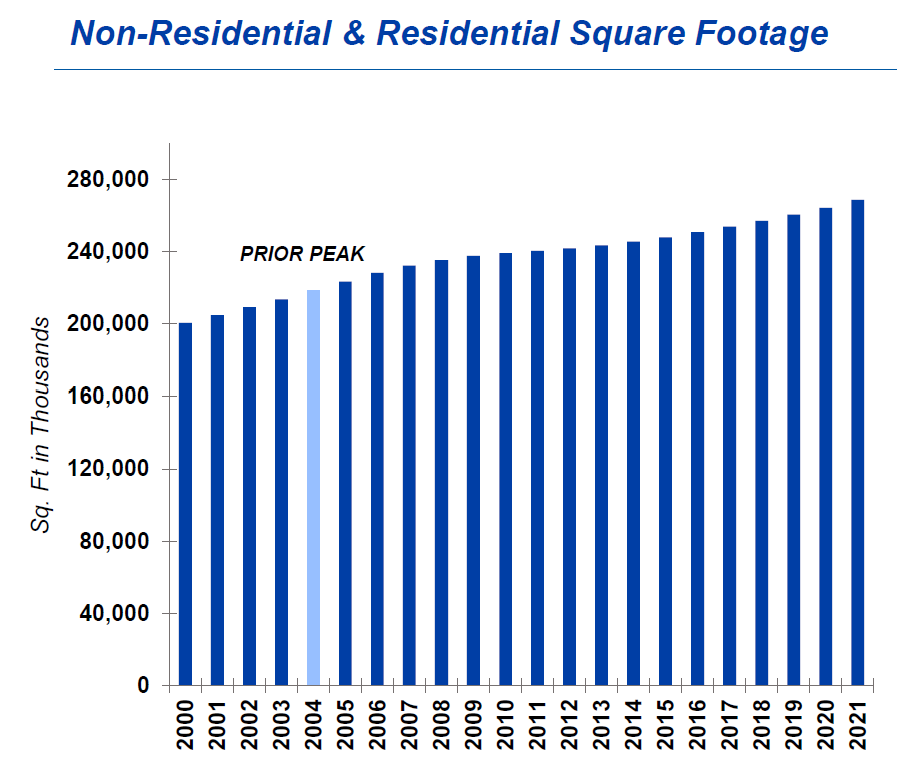
The overall paint demand breakdown in the US also clarifies while the demand can be cyclical, new housing activity is not a major driver for the overall business as it contributes only 12% of overall volume demand in the US. Given repaint has much larger contribution to the volume demand, total residential and non-residential square footage is much more relevant metric to assess the long-term demand health of Sherwin Williams.
When we look at total residential and non-residential sqft in the US, it is a much more consistent, steady 1% volume growth over the last two decades. Today, there is 23% more residential and non residential square footage out there since the prior paint demand peak in 2004.
Repaint is essentially a source of recurring revenue for Sherwin Williams; instead of annual renewal as you see in software, just imagine the renewal for this product happens every 5-7 years (this is written with tongue-in-cheek but there's certainly some truth to it).
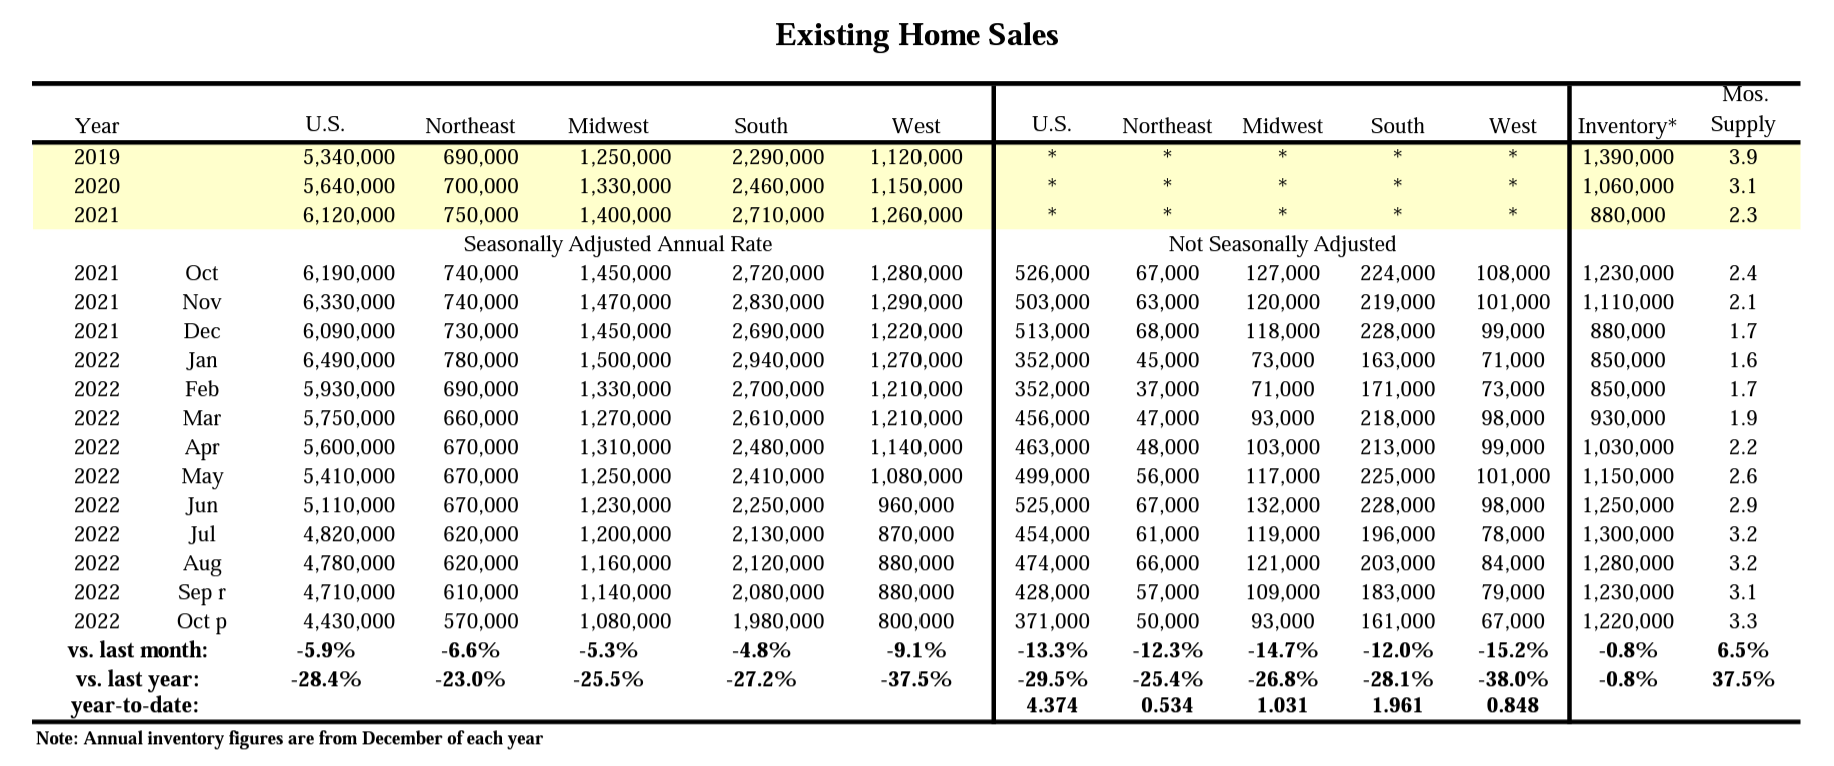
Residential repaint is key driver to Sherwin Williams' topline, and one of the key drivers to repaint is existing home sales. Why? The current homeowner tends to refresh the home with new paint prior to the sale, and then the new homeowner, after just purchasing the home, typically repaints it to make it their own. As you probably know, existing home sales is precipitously falling in recent months as mortgage rates are rising.
There is also some natural demand for repaint as the median age of US's 140-million homes is 41 years, and half were built before 1980. Moreover, while housing market is likely go through some pain given the pace of mortgage rate increases in 2022, it is unlikely to be anywhere as severe as it was during the GFC. Demand can predictably take a hit in the near term, but housing supply has been tight in the lead up to current economic softness, as explained by Sherwin Williams management:
Sustained household formation underpins housing demand. And this looks to remain very solid for the next several years. 72 million millennials, now aged 26 to 41, are forming households. They're becoming first-time homebuyers. They're driving demand for entry-level homes. The issue is not demand, but rather supply.
We've gone from a significant housing surplus prior to the Great Recession to a significant housing deficit today. According to a 2021 survey by the Rosen Consulting Group, the underbuilding gap in the U.S. totaled more than 5.5 million units over the last 20 years relative to household formation. When you add the loss of existing units through demolition, natural disaster or obsolescence, the implied cumulative demand-supply gap totals 6.8 million units.
In order to fill the gap 5.5 million over the next 10 years and accounting for growth, building would have to accelerate well above the current trend to more than 2 million units per year. In 2021, just to put it in perspective, we built about 1.3 million units per year -- for the year.
Even if you take the management's rationale with a grain of salt, there is certainly a lot of truth to it. What happens to housing market will have an impact on repaint activity (perhaps with a lag) and hence on Sherwin Williams' operating performance in the near term, but what seems to be abundantly clear is housing supply and hence repaint activity will have to continue to rise over the next 10 years even if it takes bit of a zigzag path to get there. In other words, in this case the next decade seems to be easier to see than the next year.
Performance Coatings Group (PCG)
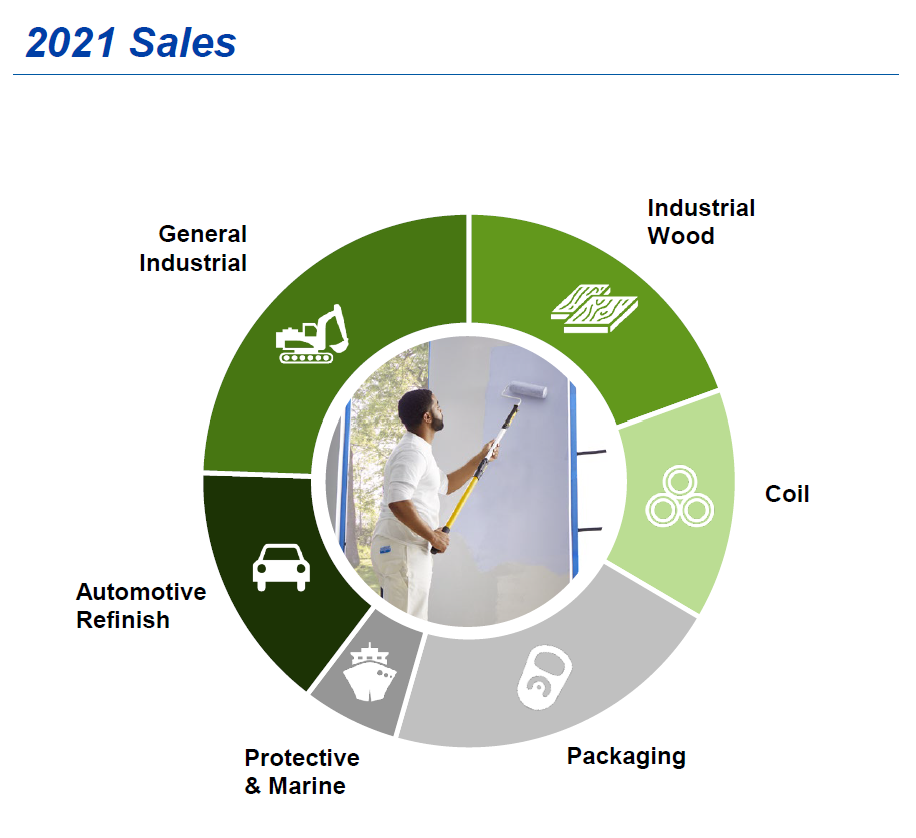
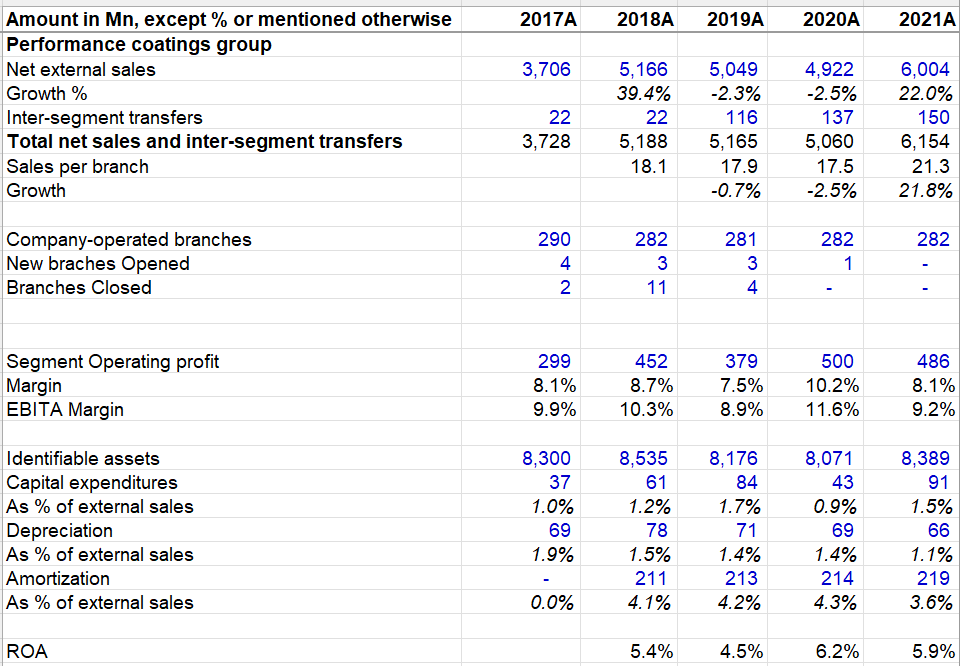
PCG segment consists of six divisions: General Industrial, Automotive Refinish, Industrial Wood, Coil, Packaging, and Protective & Marine. Sherwin Williams has 282 branches across 44 countries in this segment. It utilizes both direct sales staff and outside sales representatives to retailers, dealers, and other third-party distributors.
Sherwin Williams has been pretty acquisitive in this segment to expand its business in PCG. Following Valspar's acquisition (which had both consumer and PCG business) in 2017, Sherwin Williams acquired 7 more companies to bolster their business in PCG segment.
Looking at numbers, this has been quite unexciting business given consistently MSD ROA in this segment for the last five years. Again, manufacturing and distribution facilities (39 and 37 respectively) as well as the intangibles and goodwill following acquisitions create a downward pressure on ROA, but that's probably not a good excuse for MSD type ROA. Operating margin was also mostly HSD to LDD margin even though in the latest Investor Day management mentioned,
we have such confidence in our commitment to achieving an ROS in the high teens, low 20s, for the PCG business.
It is perhaps fair to be skeptical of such promises given historical numbers. However, given low capital requirement (capex is ~1-1.5% of sales) and staple nature of the business, this segment can become a pretty decent business if margin can even be ~15% over the long term.
Now that we have a good idea about Sherwin Williams business model, let's move onto understand the competitive dynamics in this industry.
Section 2: Competitive Dynamics
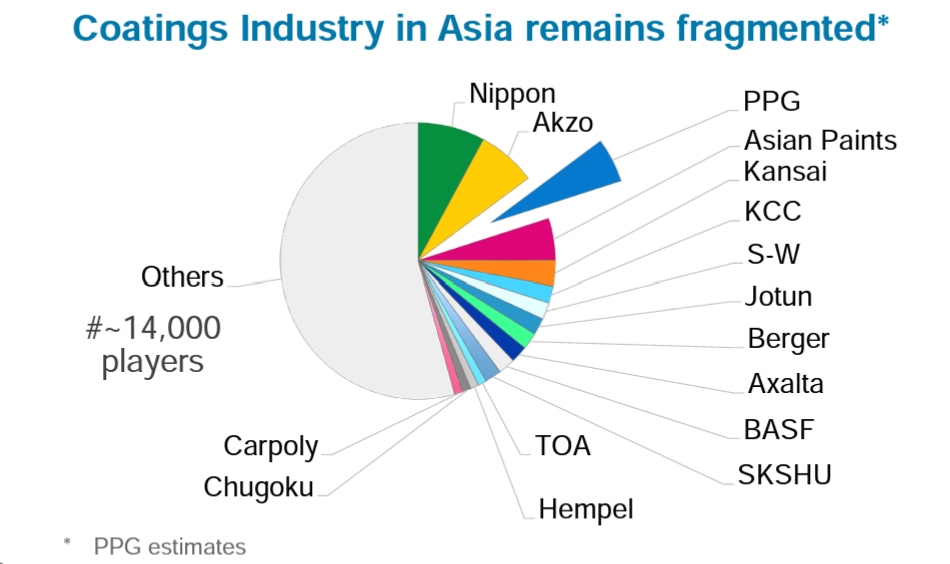
Paint and Coating industry can be very regional in nature and hence, it is not the same competitor everywhere as it typically varies by region. The closest global competitor of Sherwin Williams is PPG Industries. In their 2021 Investor overview, PPG mentioned size of Coatings industry is estimated to be $140 Bn in 2020. Since PPG estimated the industry size to be $130 Bn in 2015, it implies 1.5% CAGR growth for the overall industry. While that appears quite anemic and lot slower than global nominal growth, the large players still have lot more room for consolidating the industry as smaller players have ~60% global market share in this industry.
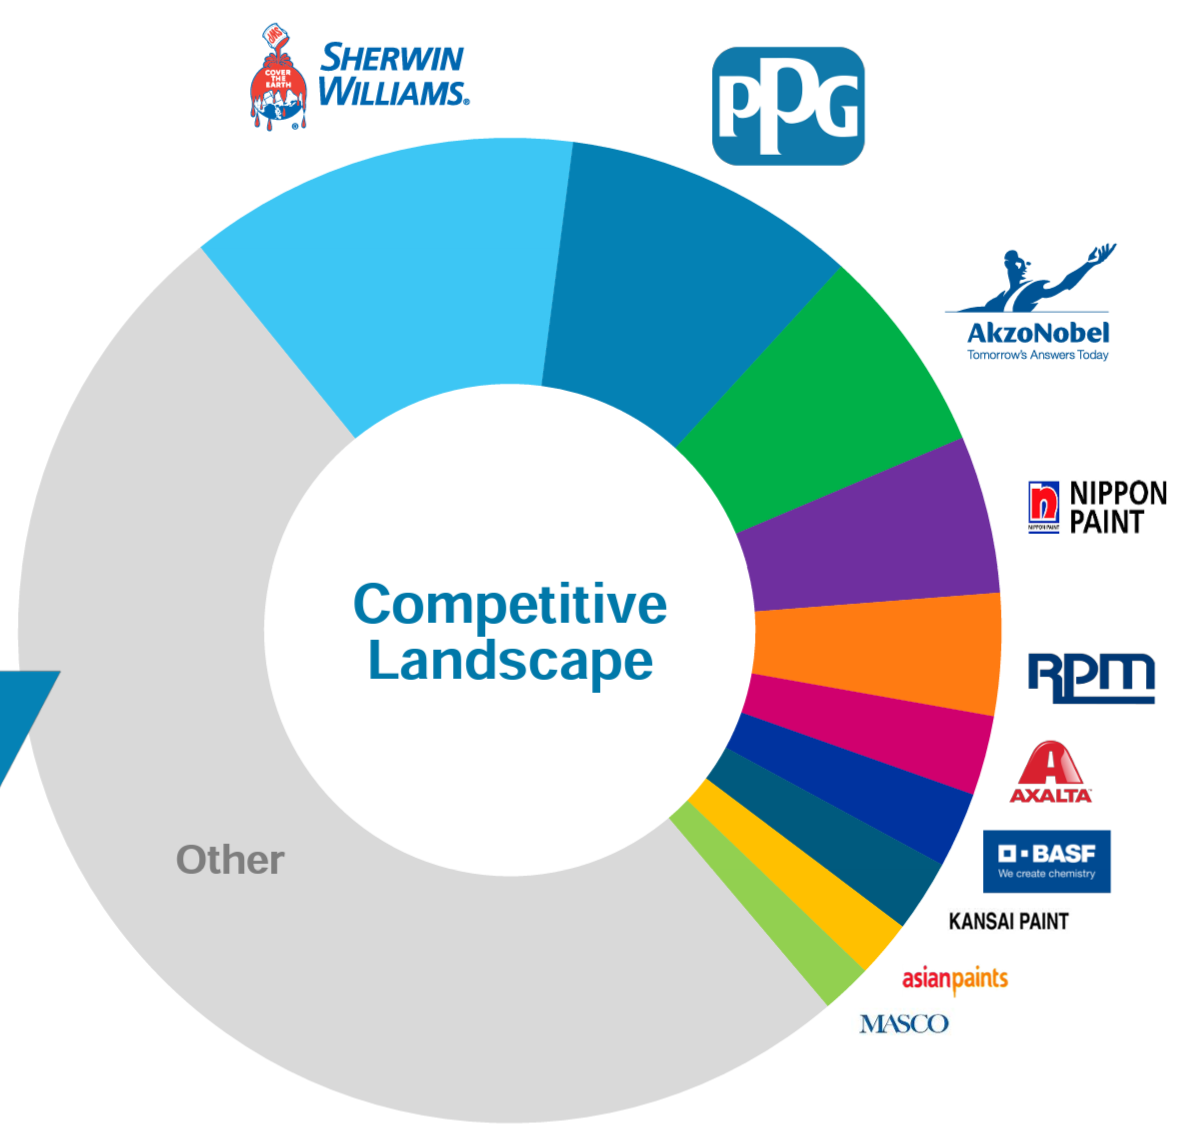
However, even though there seems to be lot of room for consolidation globally, the level of consolidation differs wildly by region. For example, the top three players (Sherwin Williams, PPG, Behr) in North America have ~80% market share whereas top three players in Asia have ~20% market share. This is, of course, not a fair comparison since North America is, well, mostly the US whereas Asia is a huge and incredibly diverse continent with ~50 countries.
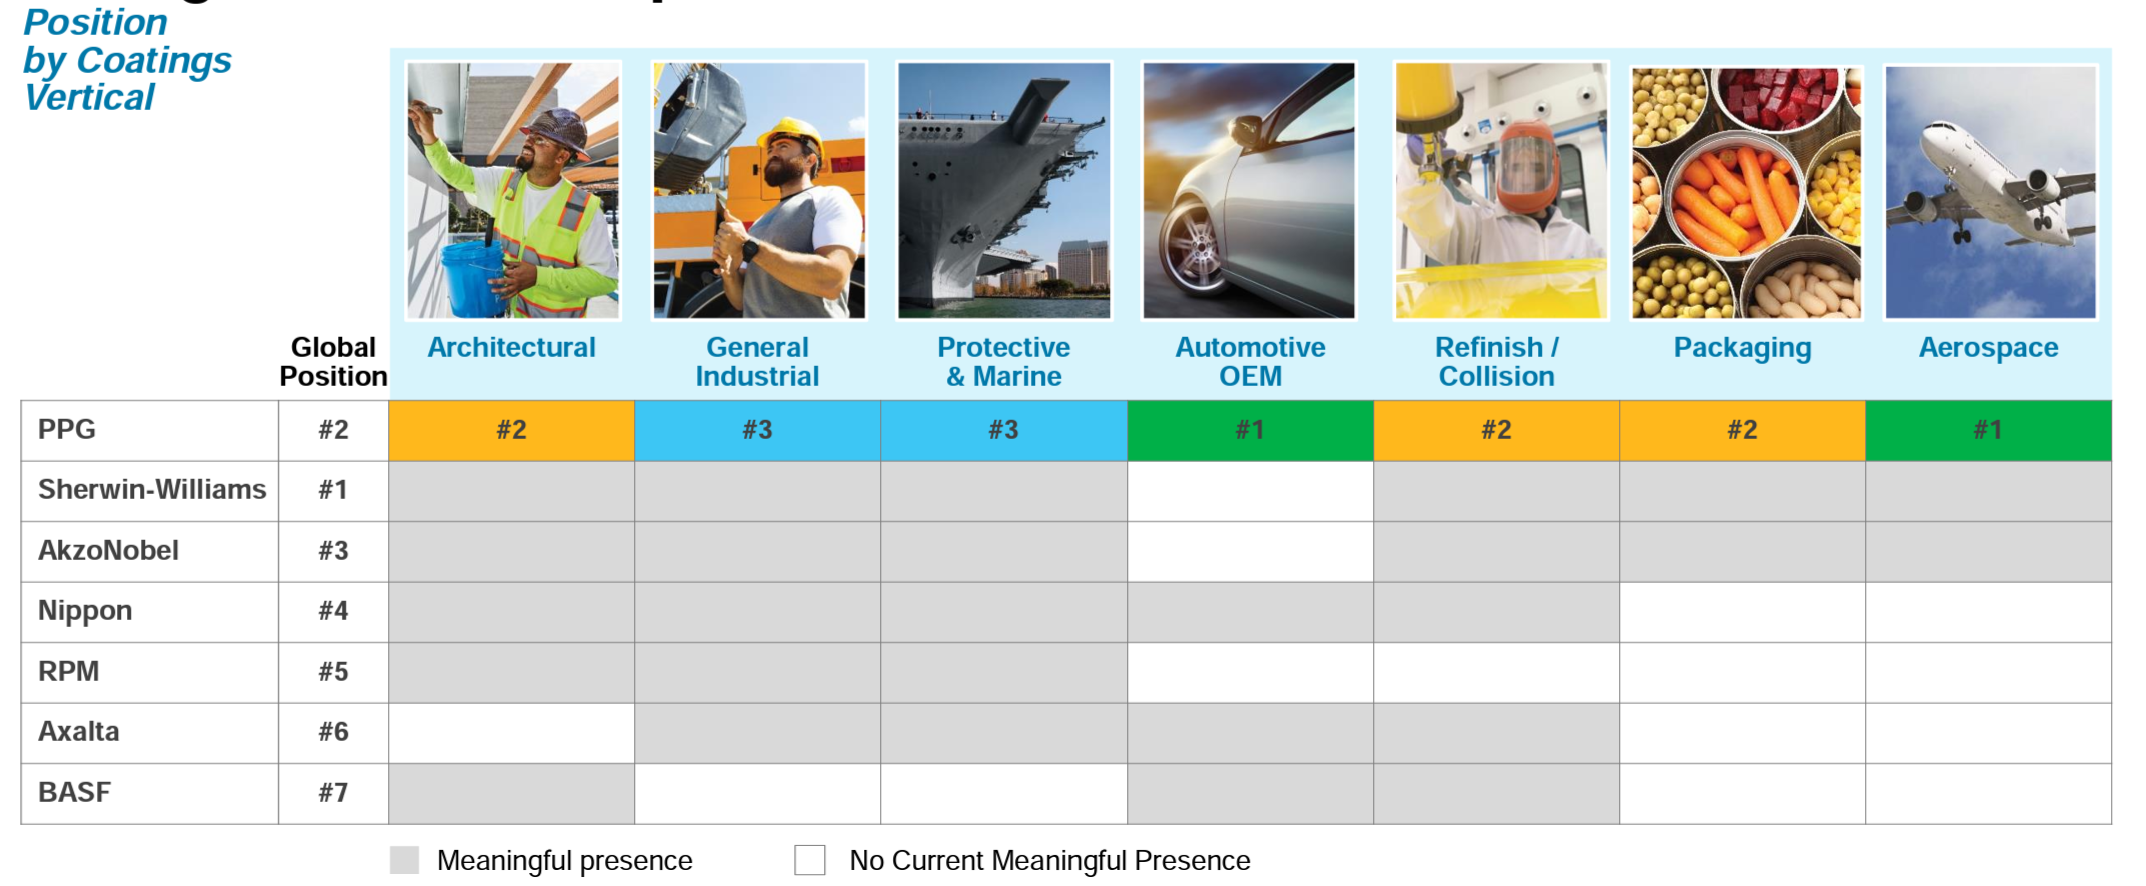
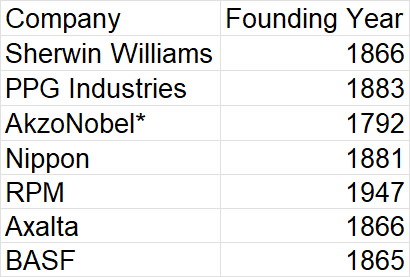
Beyond geography, the industry can also be segmented by use cases. Of the $140 Bn global coatings and paint industry, architectural segment is ~$60 Bn, General Industrial is ~$40 Bn, Protective & Marine, Packaging, and Aerospace is $22 Bn, and Automotive OEM & Refinish/Collision segment is ~$20 Bn in size. While Sherwin Williams is the global leader in the Coatings/Paint industry, they are not the leader in every use case. PPG, for example, leads in Automotive OEM and Aerospace industry. In fact, most of the industrial segments are dominated by PPG and AkzoNobel. Of these segments, I think Architectural paint's economics is the most lucrative one because of the fragmented nature of the end customers whereas many industrial use cases are riddled with consolidated customer base. Just imagine the negotiating power Boeing and Airbus can have over PPG/Sherwin Williams and you'll realize what I am talking about!
When PPG shared a similar market share data by segment in 2015, it mentioned Sherwin Willams' global market position to be #3 (SHW was #1 in Architectural segment even in 2015; so I'm talking about the overall Coatings industry), followed by PPG at #1 and AkzoNobel at #2. However, following Sherwin Williams' acquisition of Valspar which was at #4 in 2015, Sherwin Williams eventually became #1 global player in coatings industry.
One thing that I noticed while studying this industry is just how old these companies are. These companies are older than perhaps many countries as most of the leading players in coating industry were founded in the 19th century! Sherwin Williams itself was started 90 years after the independence of the US .
Given PPG and Sherwin Williams are the closest competitors and have been publicly listed for decades, I was curious to see their performance against each other decade by decade. I use KoyFin (and Tikr) for data, and KoyFin only seems to have data from 1968. So I looked at these two companies performance every 10 years since 1968. Sherwin Williams experienced a lost decade in the first 10 years (1968-1977) whereas PPG was +70% during the same time. Since then, Sherwin Williams has outperformed PPG in every single decade:
1978-1987: SHW +783% vs PPG +714%
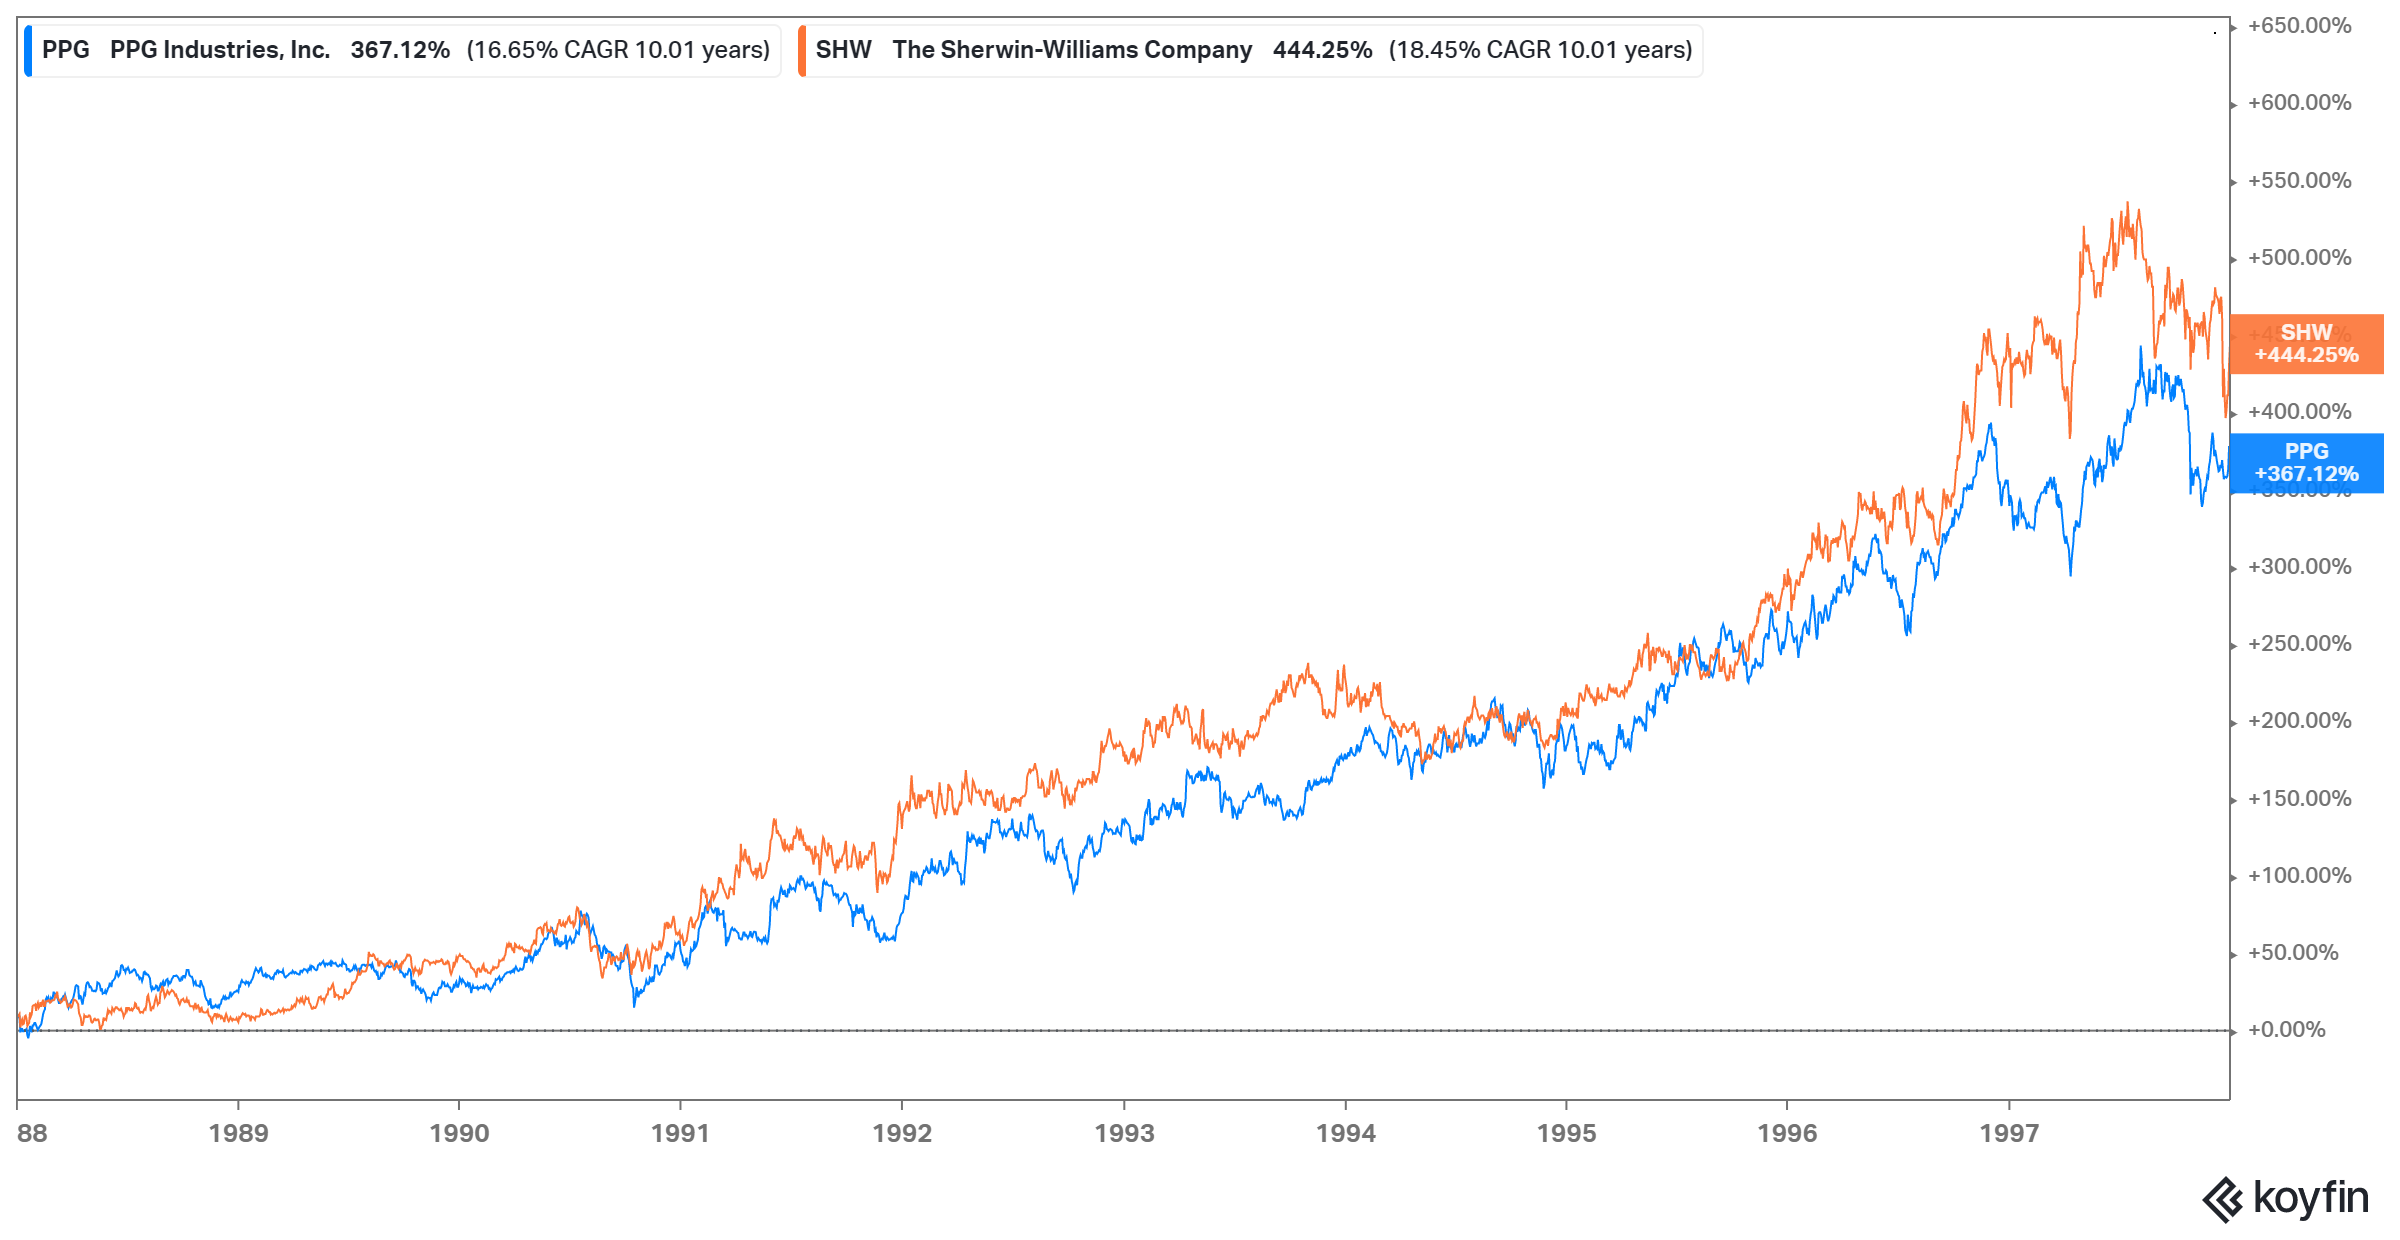
1988-1997: SHW +444% vs PPG +367%
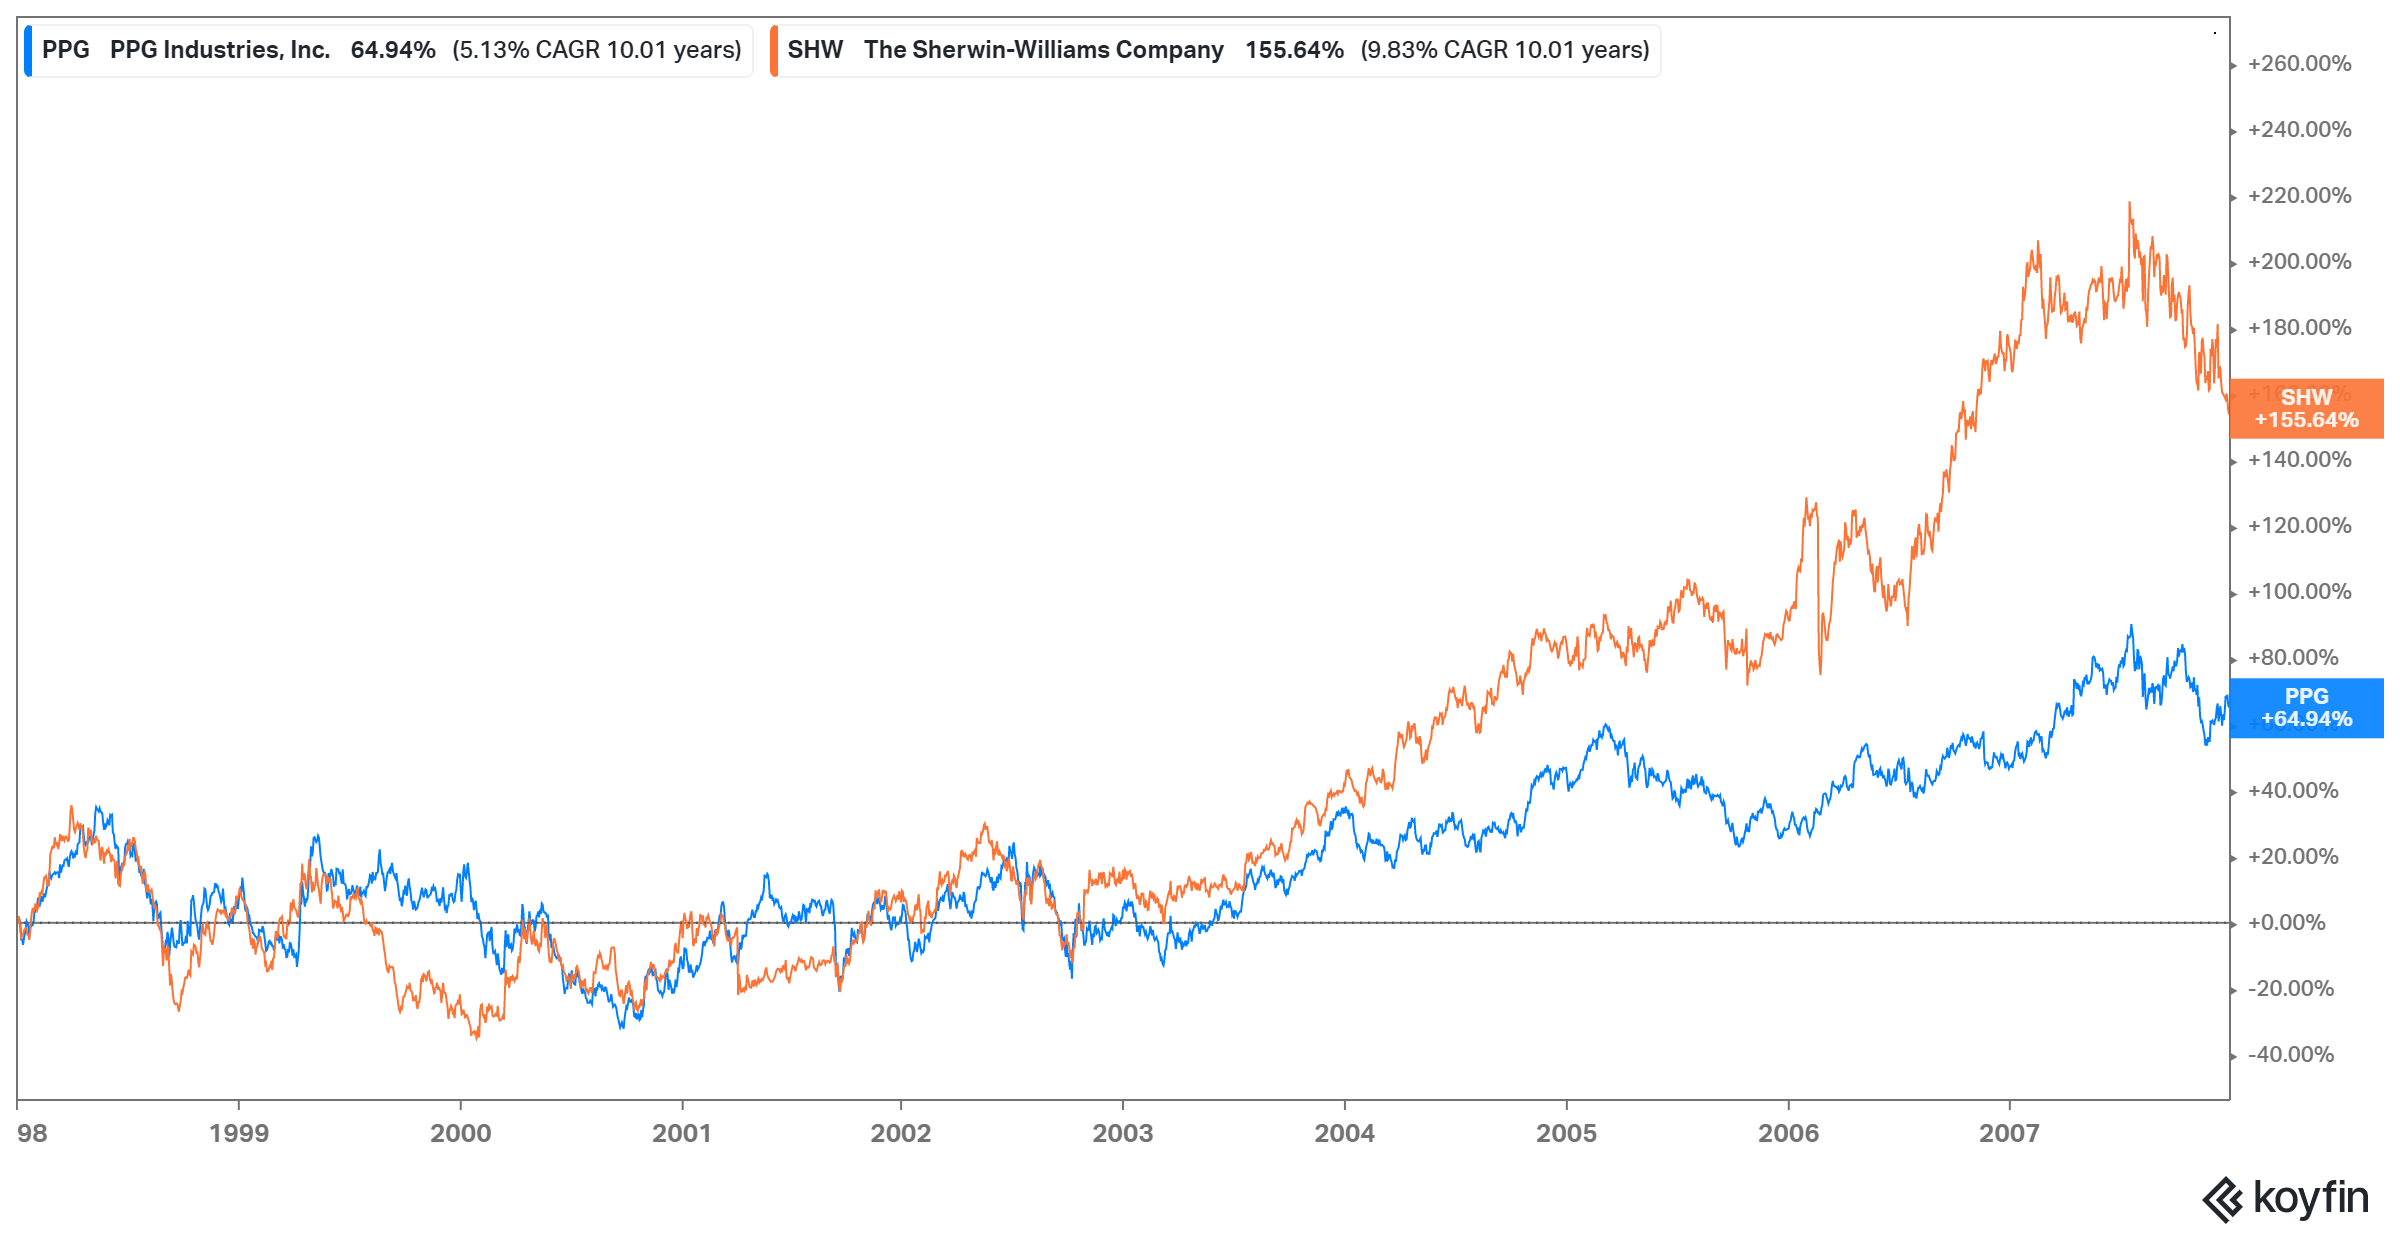
1998-2007: SHW +155% vs PPG +65%
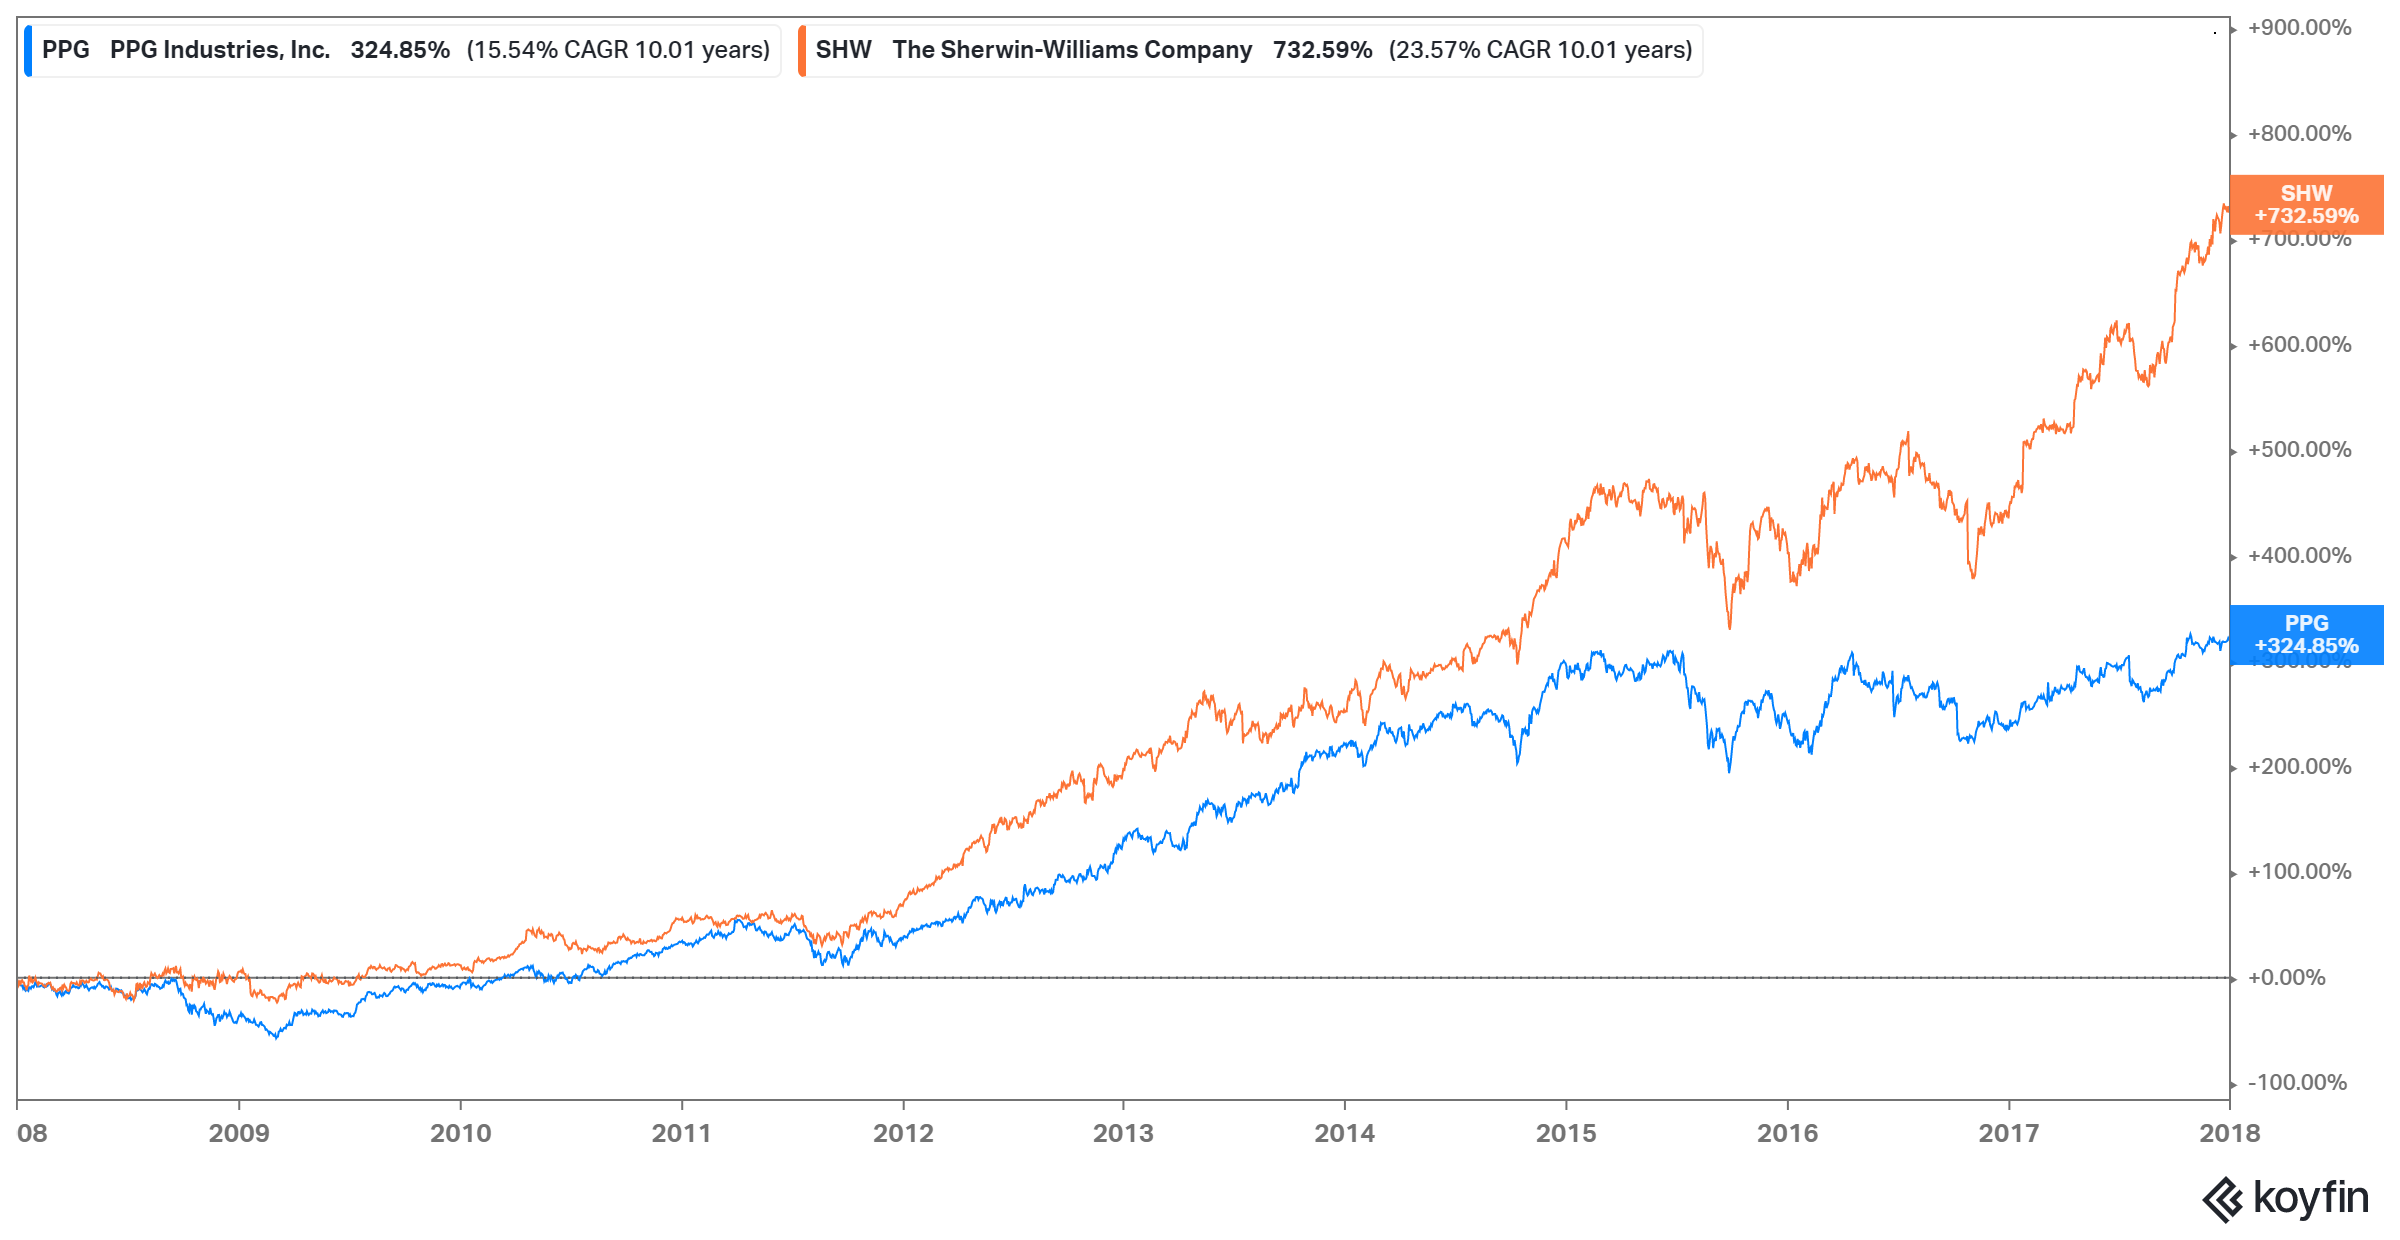
2008-2017: SHW +733% vs PPG +325%
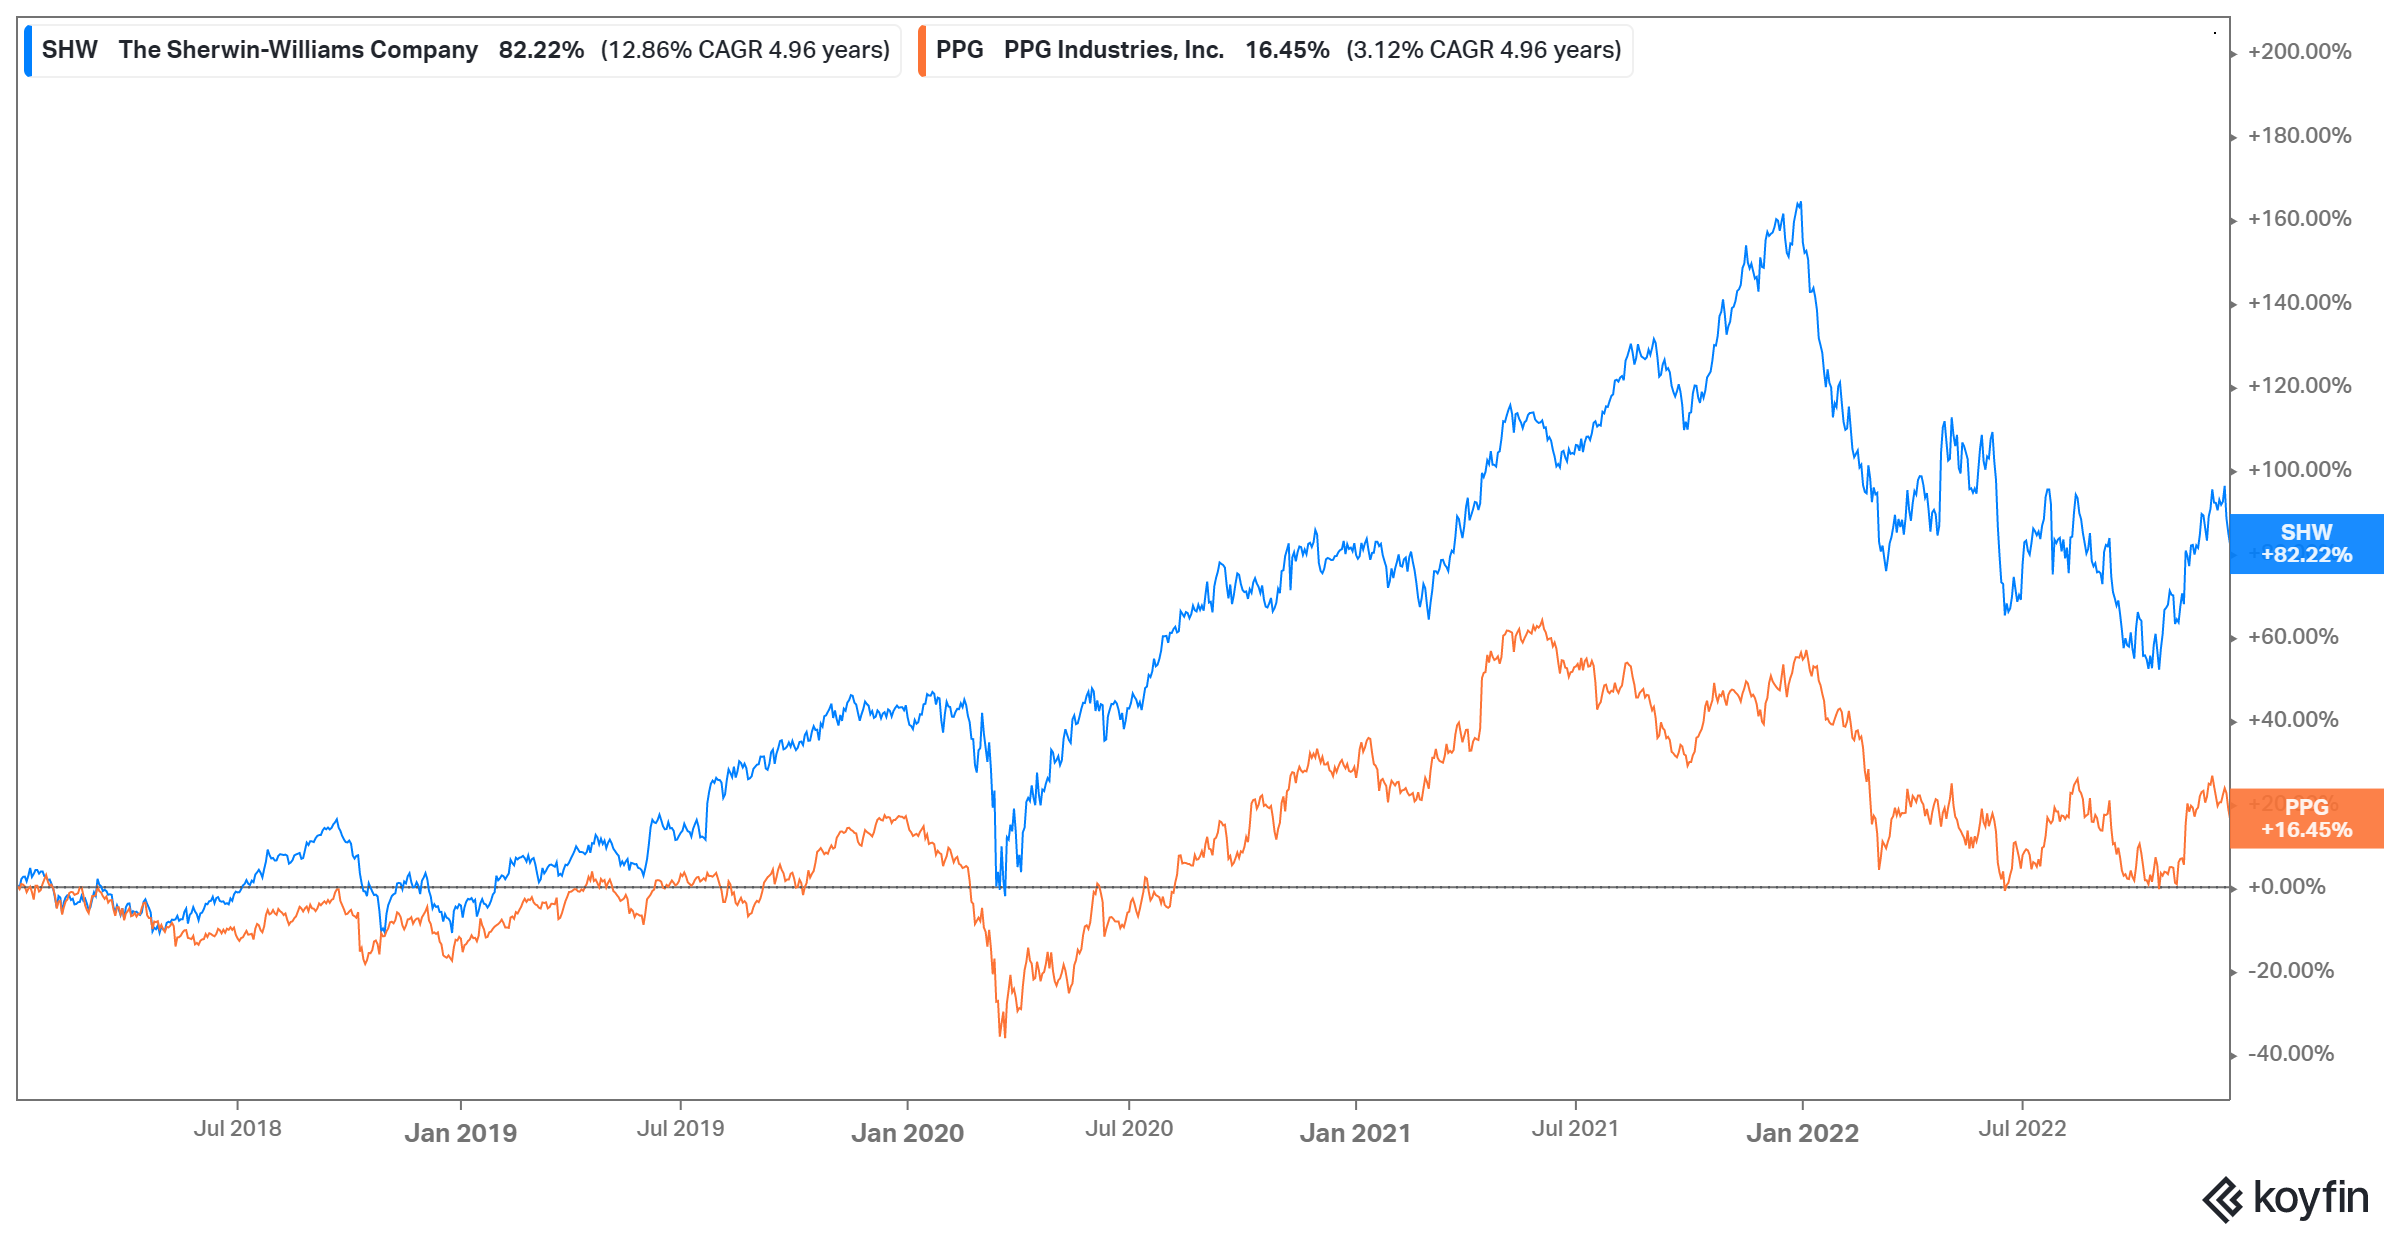
2018-2022 (Dec 16, 2022): SHW +82% vs PPG +16%
Here's a graphical representation of the decades:
1968-1977
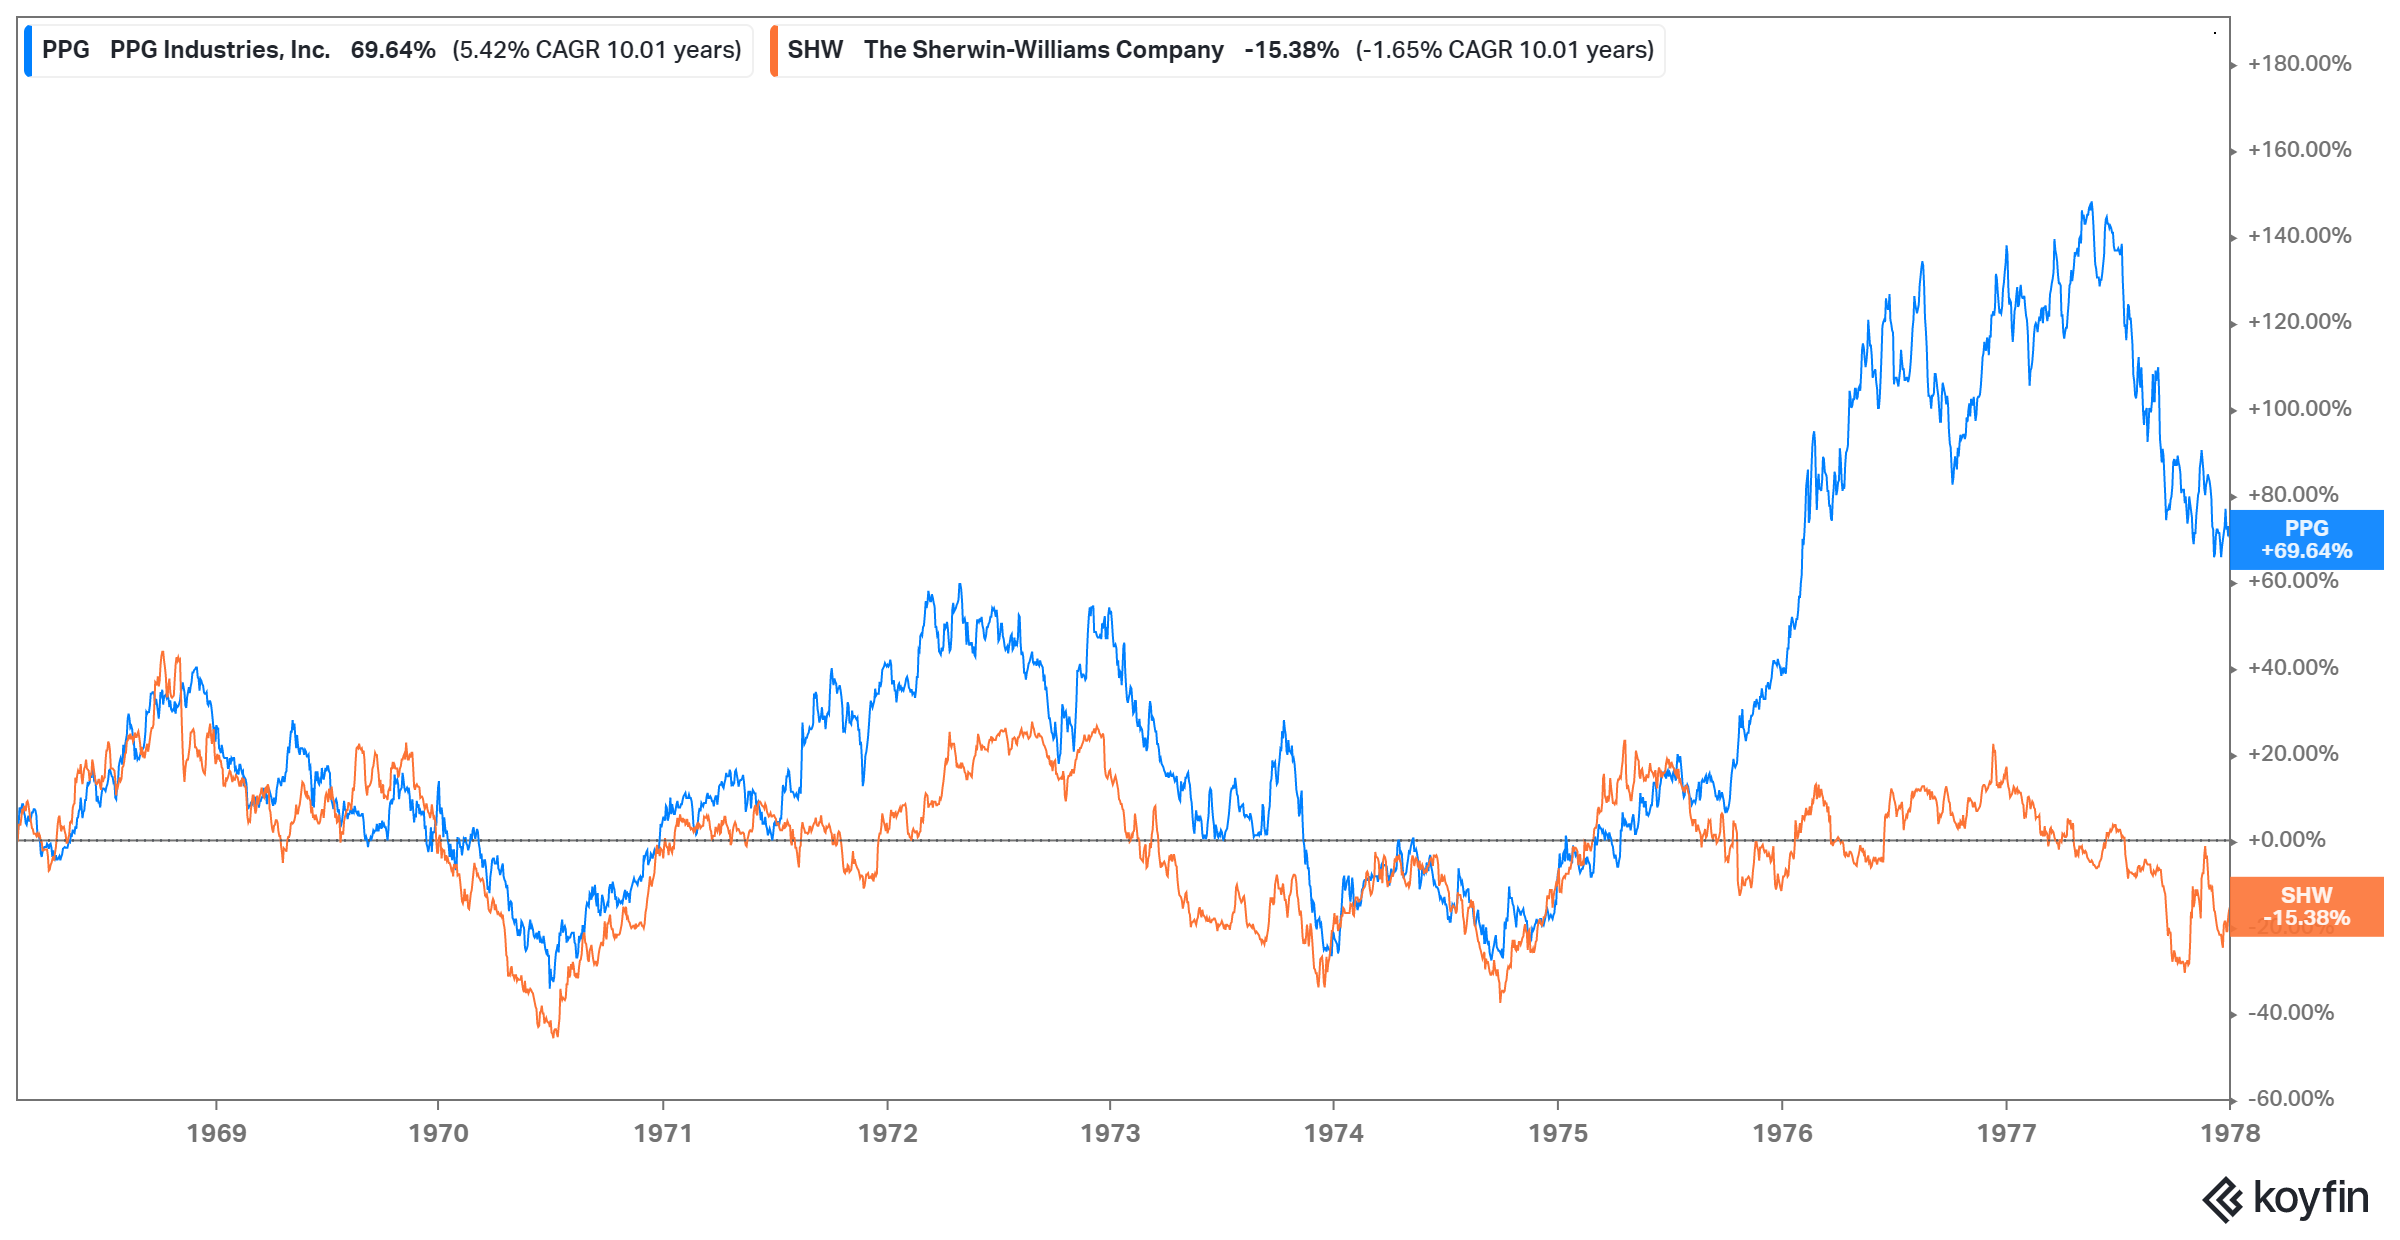
1978-1987
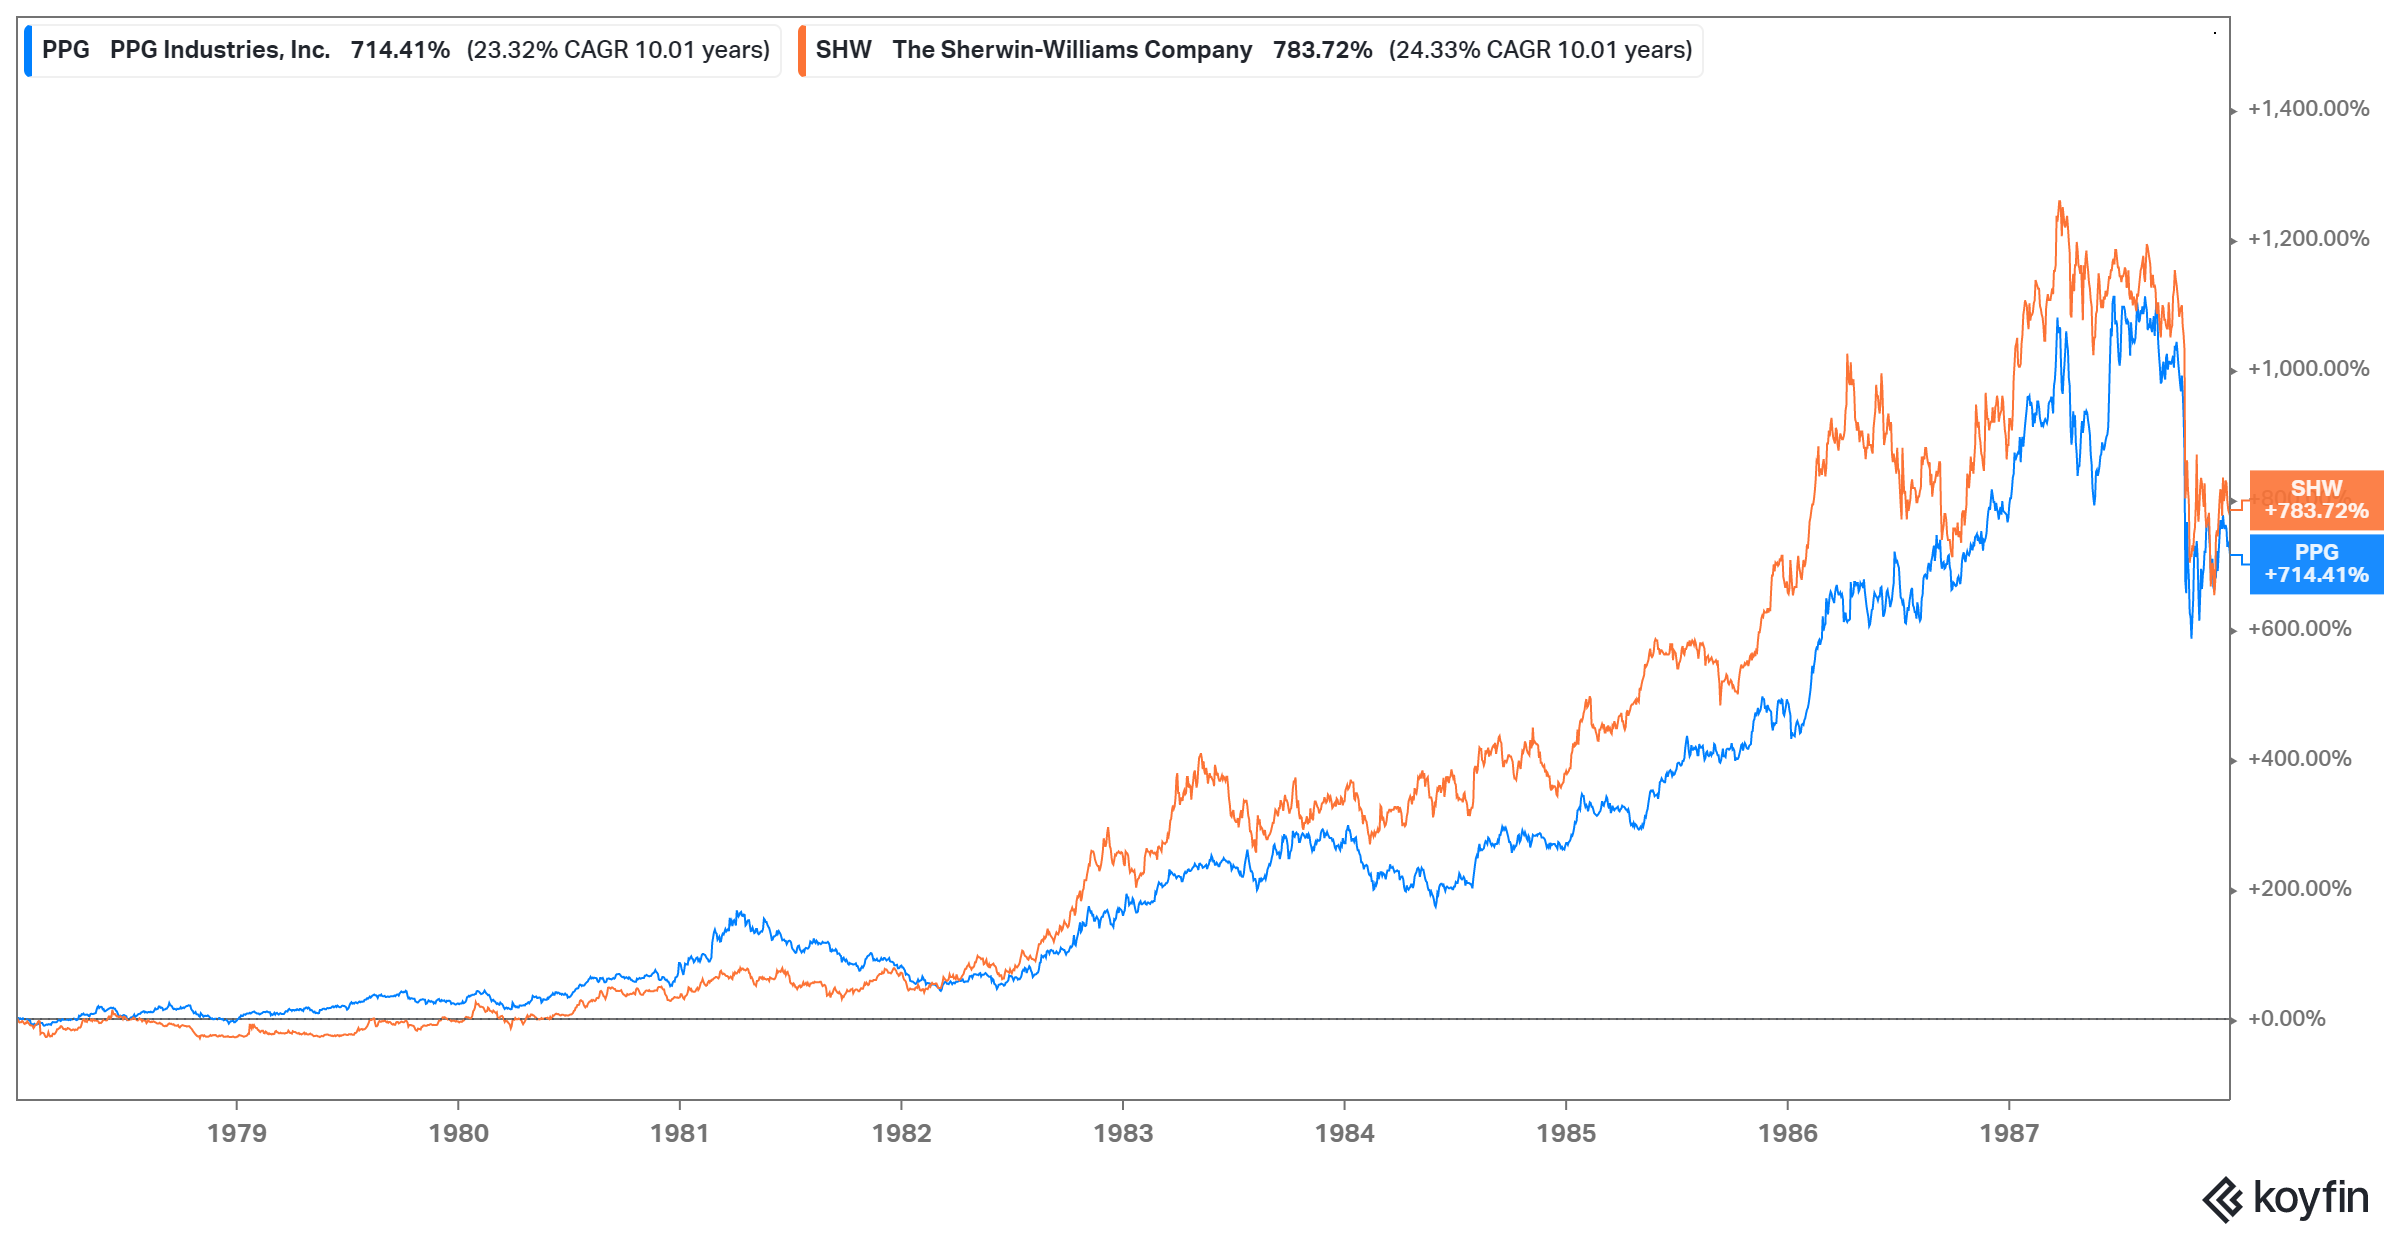
1988-1997
1998-2007
2008-2017
2018-2022 YTD
While Sherwin Williams clearly performed better than PPG, ultimately long-term shareholders of both companies did quite well. There are perhaps multiple reasons why they did so well for so long, but pricing power is likely to be one of the key reasons.
Some investors may be dissuaded by the cyclical nature of the industry in both demand and supply side: Not only the end market (i.e. new housing activity, repaint/remodeling activity etc.) is somewhat cyclical, cost of the raw materials (e.g. Titanium Dioxide, resins, latex etc.) are also cyclical. So, I too naturally had this question why these companies did so well despite the cyclicality.
I think in both fronts there were mitigating factors to the cyclicality that many may not have appreciated for a long time. Let's talk about the demand side first.
As I have elaborated in Section 1, demand for paint is not quite immune from cyclicality. However, these cycles are unlikely to continue to downward trajectory for an extended period since paint is staples of society. The aesthetic appeal of paint is quite fundamental in nature, and there is nothing in sight to alter such perception. You may delay to repaint your house, but as long as you are not permanently economically crippled, you will repaint eventually. So, the lower demand in any recession is mostly ephemeral in nature and over the course of an economic cycle, the wallet share for these companies is likely to be quite stable.
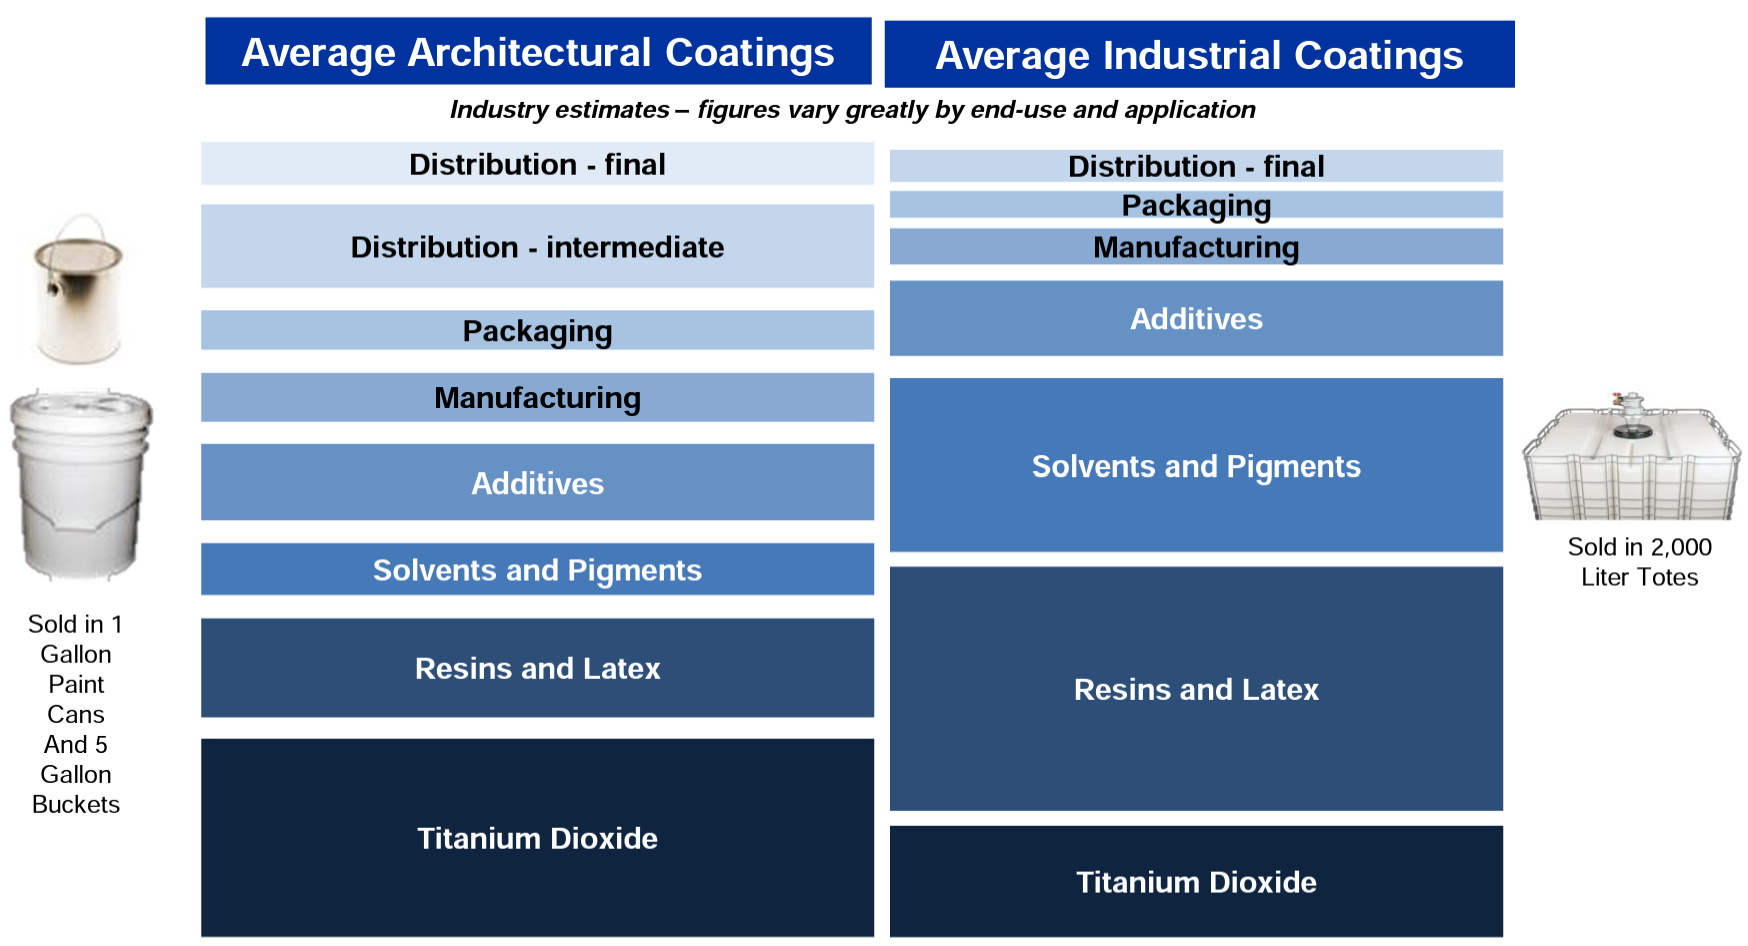
Now let's talk about the supply side. Raw material costs are often ~60% of total costs (see below). Since the commodity prices are inherently cyclical, one can imagine how that can be very inconvenient for paint manufacturers such as Sherwin Williams. However, considering the consolidated industry structure of paints/coatings industry, the players behave quite rationally and just pass the costs to the consumers, mostly with a lag. As a result, the wallet share in terms of gross profit in real terms also doesn't quite go down for these companies over the economic cycle.
Both PPG and Sherwin Williams talk about their pricing power and their ability to pass the cost to consumers. Here's one quote from Sherwin Williams:
as raw materials increase, we typically see a short-term contraction in gross margins. Then as pricing actions catch up with the raw material inflation, we start to see recovery and then expansion as raw material costs moderate.
And acknowledging there are differences in the drivers of inflation in this cycle, we believe we are in a very similar cycle to 2010 through 2012, where we experienced significant raw material inflation and implemented 6 price increases in 22 months. As raw materials moderated, we experienced significant gross margin expansion to approximately 600 basis points from 2013 to 2016, with 2016 being the all-time high gross margin of the company. We continue to expect our long-term gross margins to be in the range of 45% to 48%. We have confidence in our ability to expand our gross margins long term through required pricing and continuous improvement initiatives across the company.
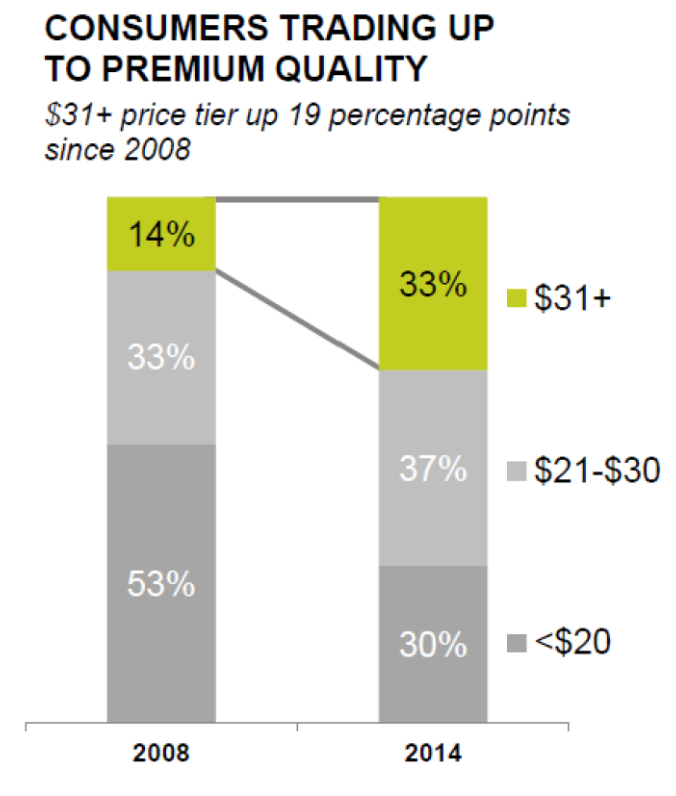
Moreover, as purchasing power increases once economy recovers (or people become richer), people seem to trade up in paint quality, which implies some sort of premiumization tailwind over the long-term.
My friend David Kim from Scuttleblurb also made similar points on pricing power in his piece on Sherwin Williams:
"A 2,000 sqft home might require 12 gallons of paint, which comes to around $400-$600 depending on quality (per homeadvisor.com). The incremental $100-$200 a homeowner ponies up for a higher quality, longer duration coat is marginal relative to the $3,000+ she pays a contractor to beautify and protect perhaps her most valuable asset. It makes little sense for a professional contractor (who ultimately decides which paint to buy for a job) to opt for an unknown brand of questionable quality since the productivity-driven labor cost savings from using higher performance paint exceeds the incremental costs of product upgrading, and in any case, a homeowner will happily pay up a bit for a paint job if doing so protects the home’s resale value...its trusted brand (plus the negligible cost of paint relative to the value of the coated house) has allowed the company to raise prices when its input costs increase (as they did from 2010-2012) and at least hold price when they decrease."
A big reason to be able to sustain the pricing power is the consolidated industry structure. Of course, not many Ivy league or talented kids from around the world are dreaming to start a architectural coating business. Even if a few of them do, their best bet is perhaps to sell their brand to one of these larger players because of the distribution prowess of the larger players. Distribution is a huge barrier to entry and source of moat for companies such as Sherwin Williams. Before I elaborate on the distribution moat, I cannot really talk about distribution moat of a physical retailer without addressing first the elephant in the room: Amazon.
I searched "interior paint" on Amazon on December 13th and here's what the top search results showed me:
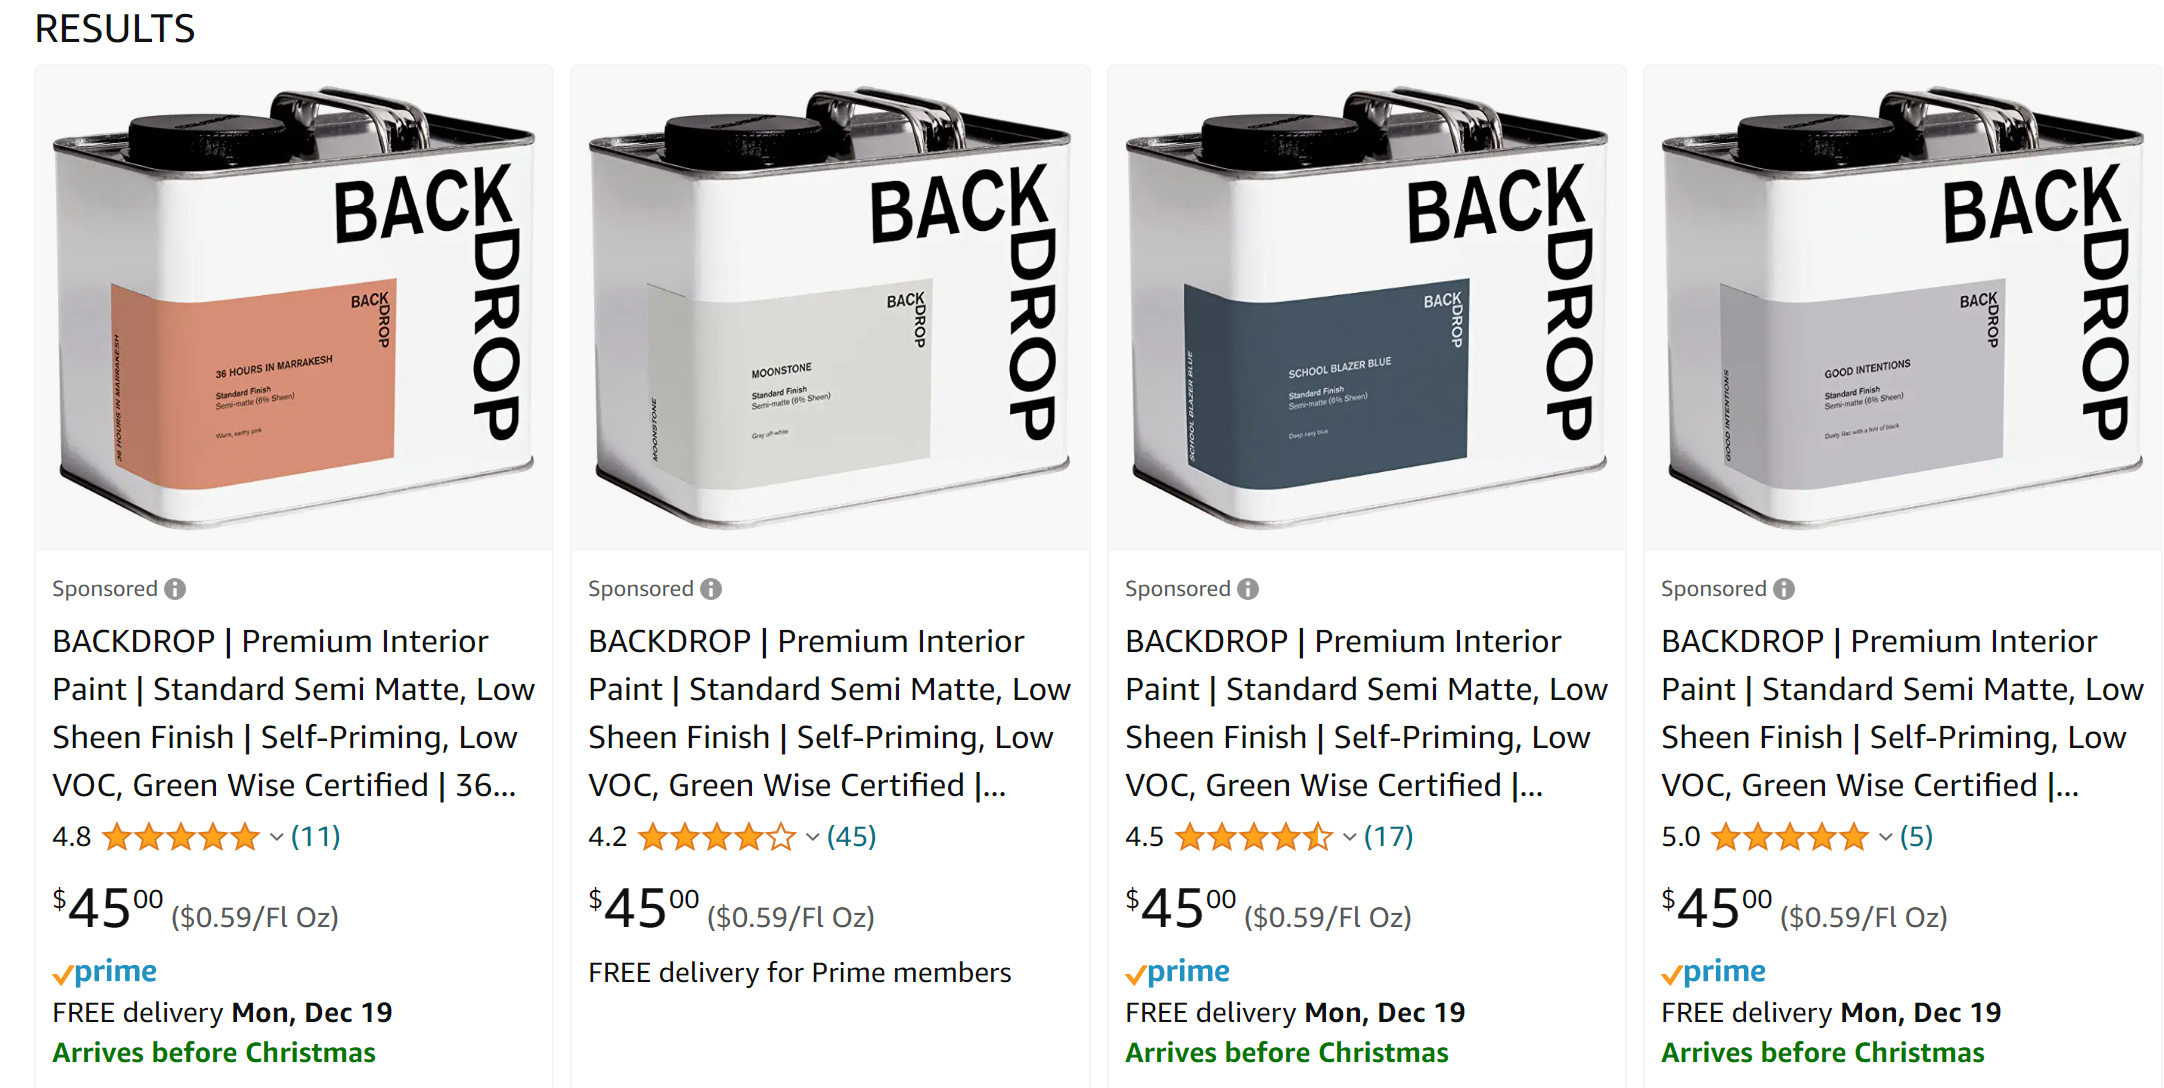
I'm not sure whether something is off, but six days lead time to get paint delivered is perhaps not going to work for Pro customers (I searched on Amazon again on 18th evening; delivery date was shown to be Dec 22nd). Now compare this with what Sherwin Williams offers to its customers and you'll intuitively understand why Amazon has found it hard to disrupt this industry (delivery is free for Pro customers):
You can schedule a delivery within 2 hours (Urgent), within 4 hours (Standard), same day (before 5pm) or next day. We highly recommend choosing Standard or Same Day unless the delivery need is truly Urgent. Typically, your delivery request will be accepted within 2 minutes by one of our delivery professionals.
As mentioned earlier, online order is certainly on the rise and it is an easy bet that in 5-10 years, the percentage of orders coming from online is going to be higher than it is today even in the paint/coatings industry. But Amazon does seem to be in the backfoot here. Online orders at Sherwin Williams are delivered by its own employees (temporary or permanent); they are much more knowledgeable about Pros' workflow than a typical Amazon delivery person. Moreover, if you want to repaint your house 5-7 years after initial paint, it is easy to find the same color with product details at Sherwin Williams, but the same cannot be said for Amazon as it is possible those 3P sellers may even go out of business by the time you want to repaint. With number of stores nearing 5,000 and total control of delivery logistics capabilities, Sherwin Williams is the elephant here and Amazon is likely to be a perennial ant in this fight. However, the rise of online orders and free delivery are also why I am less optimistic about significant SG&A leverage in the next 5-10 years. Ultimately, Sherwin Williams should optimize for durability rather than expanding near-term margins. Sherwin Williams explained this logistics moat in e-commerce on its recent Investor Day:
We've got the distribution model and platform to reach, meet and exceed our customers' ever-changing needs and expectations. This model includes our paint stores, approximately 300 industrial blending facilities that provide this customization that's so core to our business, and just-in-time delivery logistically positioned close to our customers. The model also includes several thousand strategic channel partner locations, nearly 132 manufacturing and distribution centers around the world.
And we connect all of this with the largest company-owned fleet in the industry, including over 800 tractors and 2,100 trailers and 3,000 delivery vehicles. Simply put, we can serve our customers when and where they need us.
Within Logistics Capability, our existing fleet of tractors, trailers and tank cars have proven to be a key differentiator for us. Over the last year, we've used our fleet to pick up raw materials from suppliers and deliver them directly to our production sites.
We continue to invest in our e-commerce platform and other business solution technologies that are highly focused on helping painting contractors, this is going to be a surprise to you, be more productive and more profitable.
We know these digital solutions are valuable to our customers as we continue to see strong adoption across the board, and we also know that spend increases with this PRO Plus usage as well. Coming soon are a few new other features like customer dashboards and job folders, which will enable our customers to easily manage their businesses and self-schedule delivery. And we're also launching scan a can, which offers highly efficient ways to order online.
Through our high-touch delivery service, our customers can spend more time on the job site and less time on the road. Pros who used our free delivery service frequently in 2021, on average, spent 10 more days painting instead of driving. We have over 3,100 trucks and 2,900 drivers that average over 2.3 million deliveries a year. That's over 8,900 deliveries a day. Many of these deliveries are also made the same day that the order was placed, which sets us apart from our competition. On top of that, our people also have a special understanding of customer job sites and where those products need to be stored.
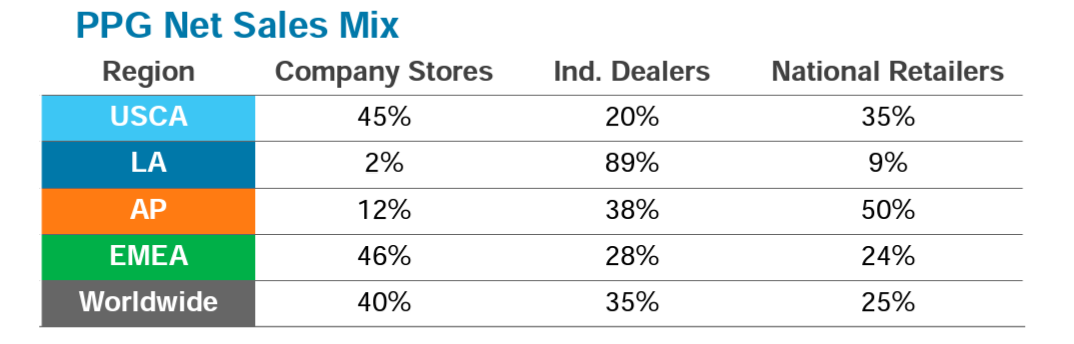
One other question that made me think is the somewhat divergent strategy of Sherwin Williams and PPG in distribution. While Sherwin Williams continues to add 80-100 new stores every year, PPG is closing stores and seems to be focusing on their partnership with national retailers. PPG doesn't disclose its number of stores, but it does disclose that 45% of its sales comes from its own stores, 20% from independent dealers, and the rest 35% from national retailers. Sherwin Williams doesn't disclose in exact terms, but if we think Consumer Brands Group as proxy for National and independent retailers, it only had 14% contribution to total sales in 2021. Therefore, it seems these two competitors are leaning towards opposite direction in terms of distribution.
The question is which one is better way to lean on. I'll first share both Sherwin Williams and PPG management's perspective on this question and then share my thoughts.
Sherwin Williams:
The key to our success and our customers' success is our unique controlled
distribution model.
Why is this model so successful, you might ask? Because unlike competing models, we own the key elements from start to finish to ensure that we can deliver a premium experience. From talent development, to product innovation, to store mission, to customer data, to logistics and much, much more, we own and control the levers that enable us to provide highly tailored solutions to meet the unique needs of the different customer segments...
...We also own our customer data and a robust digital platform. We own our point-of-sale data. The thousands and thousands of transactions that we complete across our store footprint every day provide us with deep insights into our customers' needs. Our point-of-sale data and customer history is funneled through our proprietary CRM system, which provides our reps with recommended next best actions unique to their customer based on that customer's behaviors and actions. Having reps focused on specific market segments with centralized customer data gives us great flexibility to pivot in any direction, depending upon how the market moves.
We own consistent and disciplined pricing. While other retailers may be relying on someone else's conditions, Sherwin-Williams holds full ownership over pricing decisions and promotional activity. Our ability to take quick action without a middle person lets us respond to economic demands and market shifts without getting stuck in a bind. We have the upper hand in being able to maintain effectiveness on our terms, no matter the situation.
We own inventory control. We're in the driver's seat when it comes to inventory control. From capturing the right inventory to strategically locating distribution centers, we have the right inventory and insights to match where we think the demand is and where it's going. This advantage gives us the ability to control inventory and anticipate future needs so we can focus on always providing the right product and the right product mix.
While competitors continue to add complexity through hybrid partnership models where no one has complete visibility or ownership of the customer, we add value through our controlled distribution model. From the development of our polymers to our own delivery fleet, we oversee the distribution process from start to finish to deliver a consistent customer experience that's based on simplicity and intimacy.
We're not running an e-commerce business and then this business. I mean what's unique about our model is, is that we bring all of this together in a very unique and differentiated way. The rep that, that customer is dealing with, that customer feels that, that rep is part of his or her business. That rep's responsibility is to be there when they need them. That doesn't come at the cost of a digital or e-commerce order coming in. It's all inclusive. So we're leveraging all of these things in a very unique way. We refer to it internally as kind of an ecosystem.
PPG:
"We sell through the home center environment. We sell to what we call the dealer network. We certainly have our own company-owned stores. And we go on a micro market by micro market basis and try to optimize that bricks-and-mortar similar to what other retail chains have done over the past 5 or 10 years. And we're seeing much more acceptance of professionals who prefer to have a delivery instead of a pickup situation. There was a higher catalyst of that during certainly during the pandemic when folks were not allowed in stores.
So we've seen this digital delivery acceptance. And what it really has been to allow us to do is to move to more of a hub-and-spoke approach, much more efficient approach to bricks and mortar, and these are heavy labor as well. There's labor inflation coming. And if you look -- our store network has -- we have store employees. And there's a labor component. And we're really just mirroring what's been done in other retail sectors and other professional sectors across other industries. And we think this is going to have some continued acceptance as we go on, there's not a big bang here. But this will continue to be accepted in the professional channel and allow the supply chain to get much more efficient."
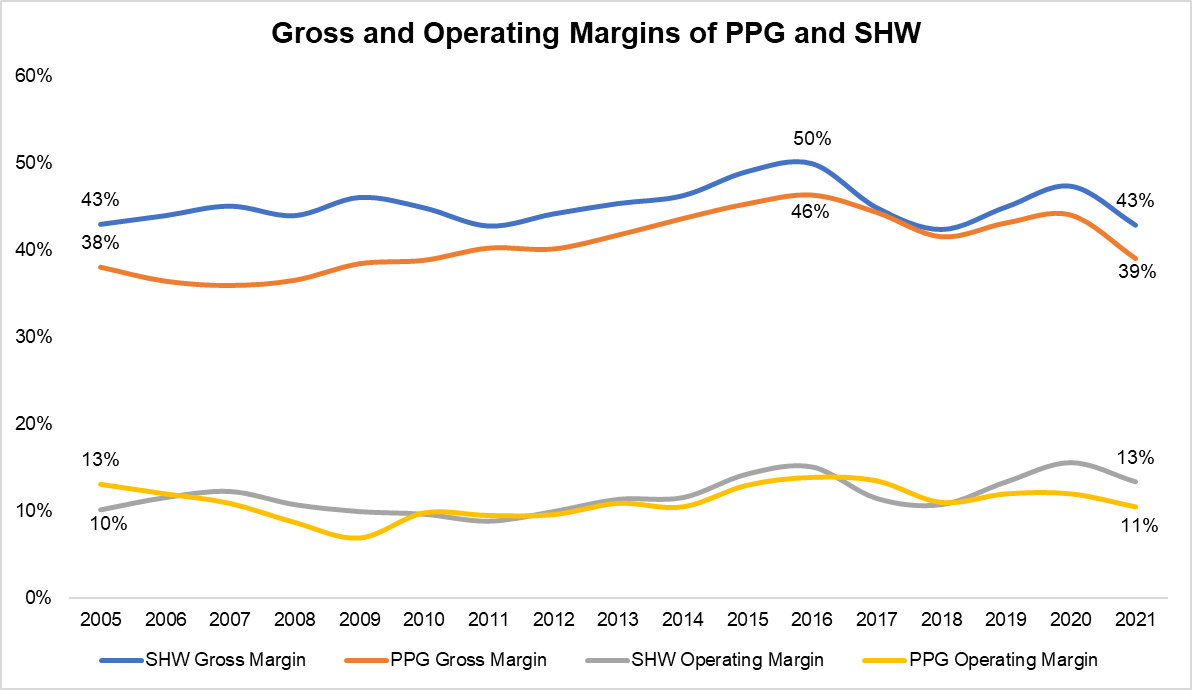
It does seem to me that Sherwin Williams' arguments are much more compelling. If we just look at the numbers, Sherwin Williams consistently posted higher gross margin than PPG, given its greater focus on selling through its own stores compared to PPG's greater reliance on national retailers. However, the operating margins are mostly similar as the higher gross margin of SHW is outweighed by higher SG&A expenses of the own store distribution model. Therefore, it can be tempting to think the choice between either of the distribution strategy is neutral. Even if the operating margins are largely similar, I would much rather own the distribution model than relying on behemoths such as Home Depot. Imagine the scenario in 20-30 years when much of the independent retailers lose most of its share to Home Depot and Lowes and the kind of negotiating leverage Home Depot/Lowes would end up accruing over PPG. Sherwin Williams is certainly playing on the hard mode compared to PPG, and while it may take decades to see the value of playing on the hard mode, I do think it may prove to be worth it.
Would you rather negotiate with Home Depot in 2030/2040 or would you negotiate lease renewals with random landlords around the country in 2030/2040? It's likely to be way harder to win or be equal at the negotiating table with Home Depot. And if Home Depot knows I'm closing stores and relying more on their stores to sell my products, I would probably be lucky to keep my operating margins at 10%.
Section 3: Capital Allocation
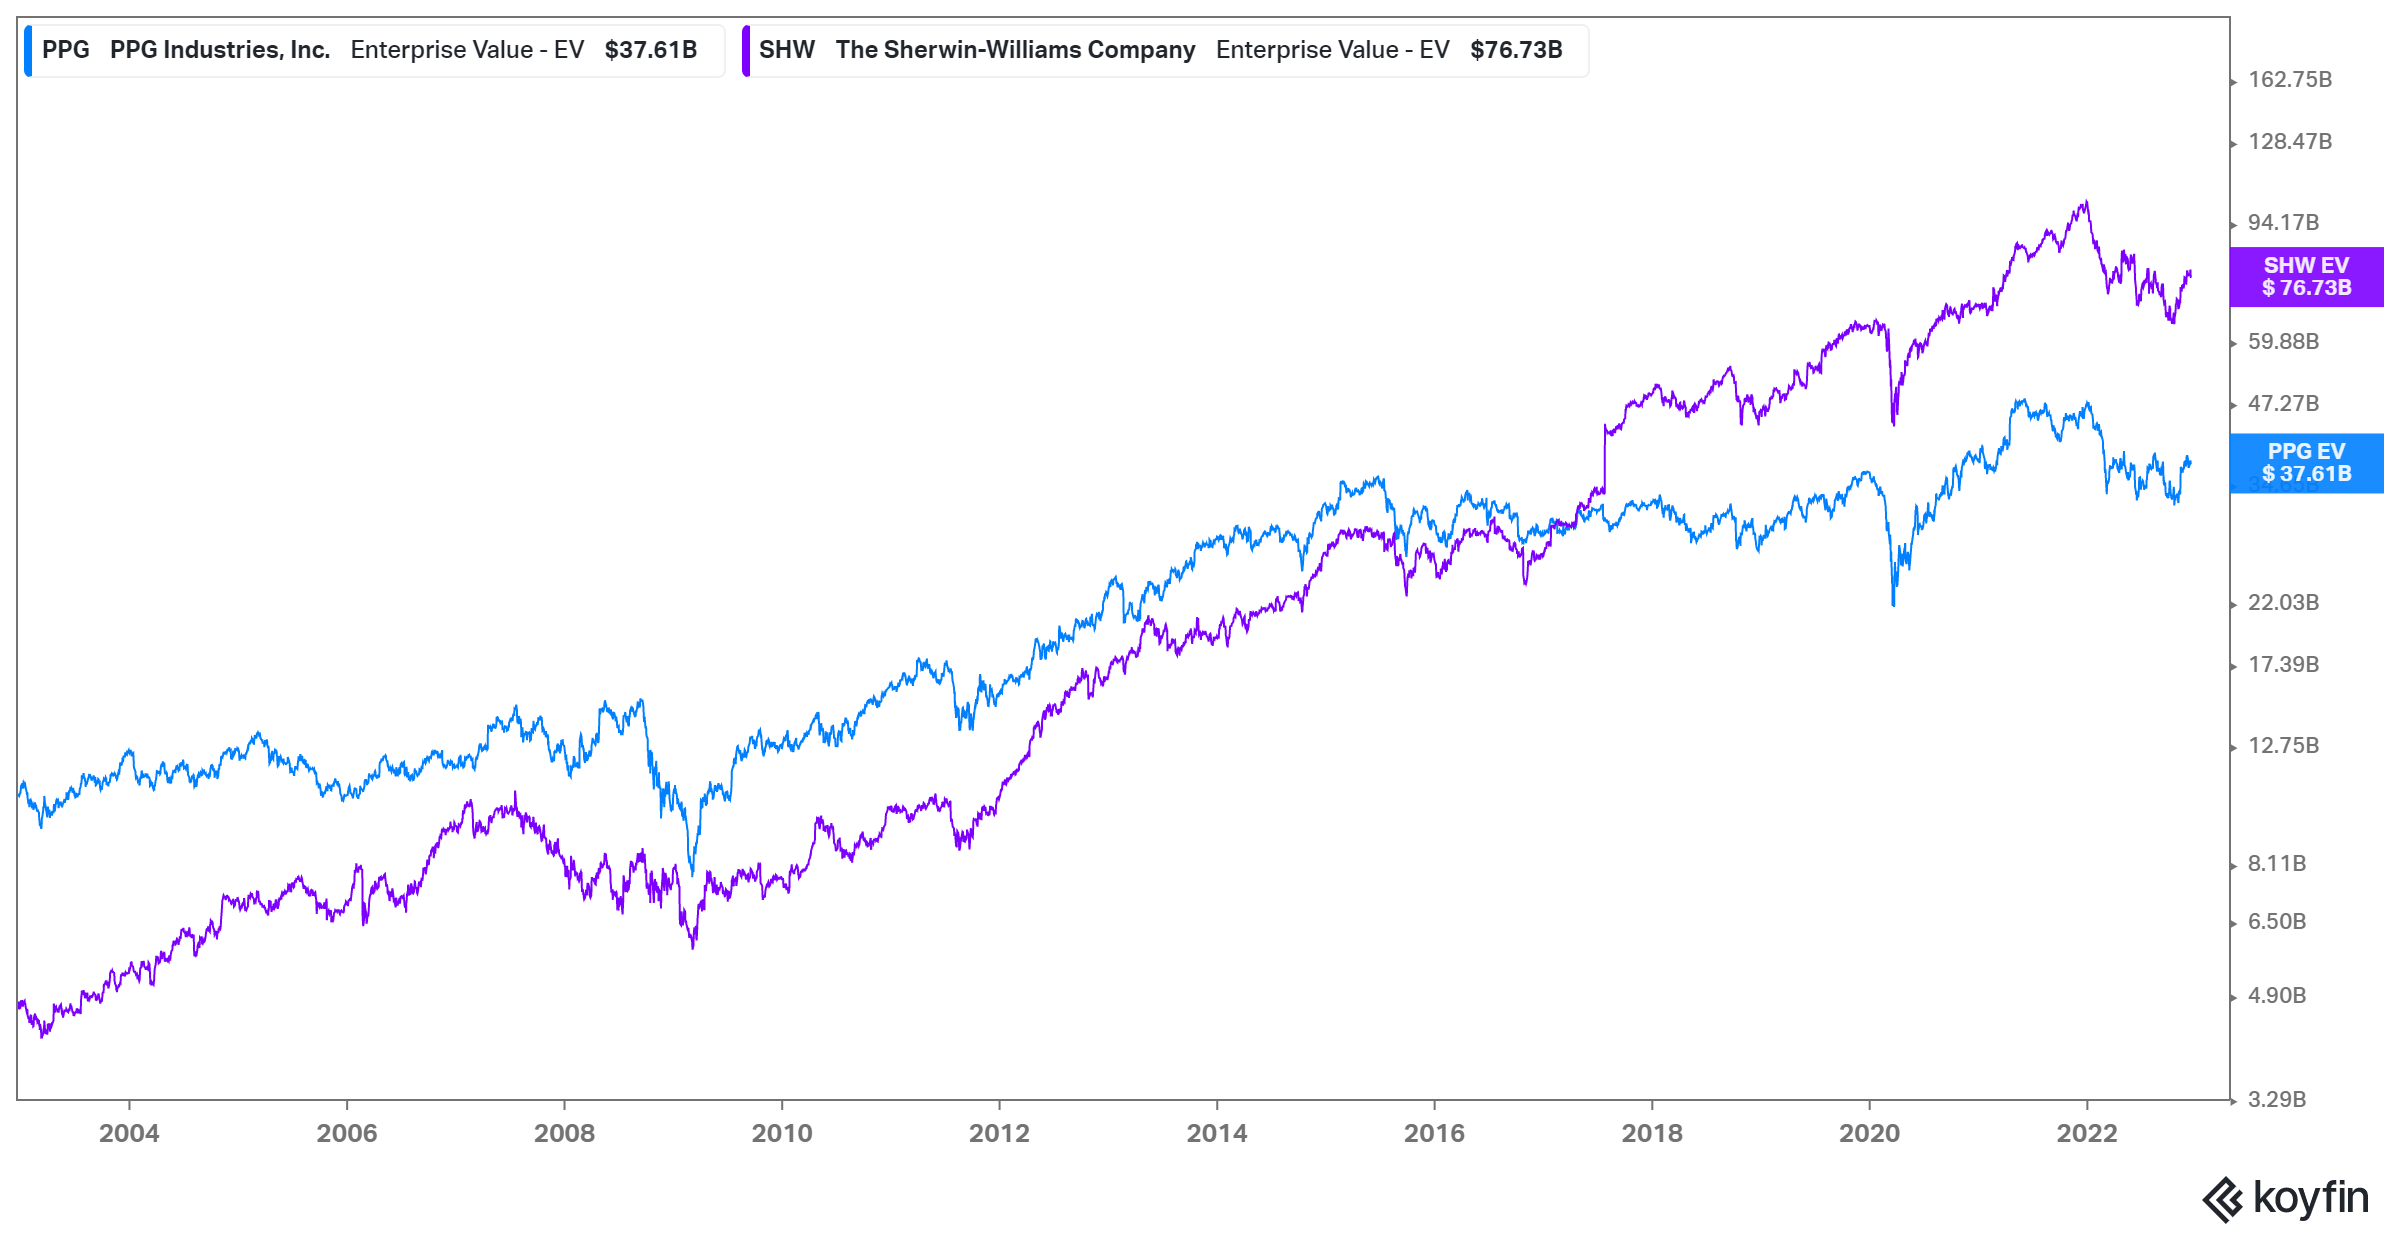
From 2002-2017, PPG used to have higher Enterprise Value (EV) than Sherwin Williams. Today, Sherwin Williams has almost twice the EV of PPG. In fact, in 2002, their position was completely reversed as PPG had $10 Bn EV vs SHW's $5 Bn.
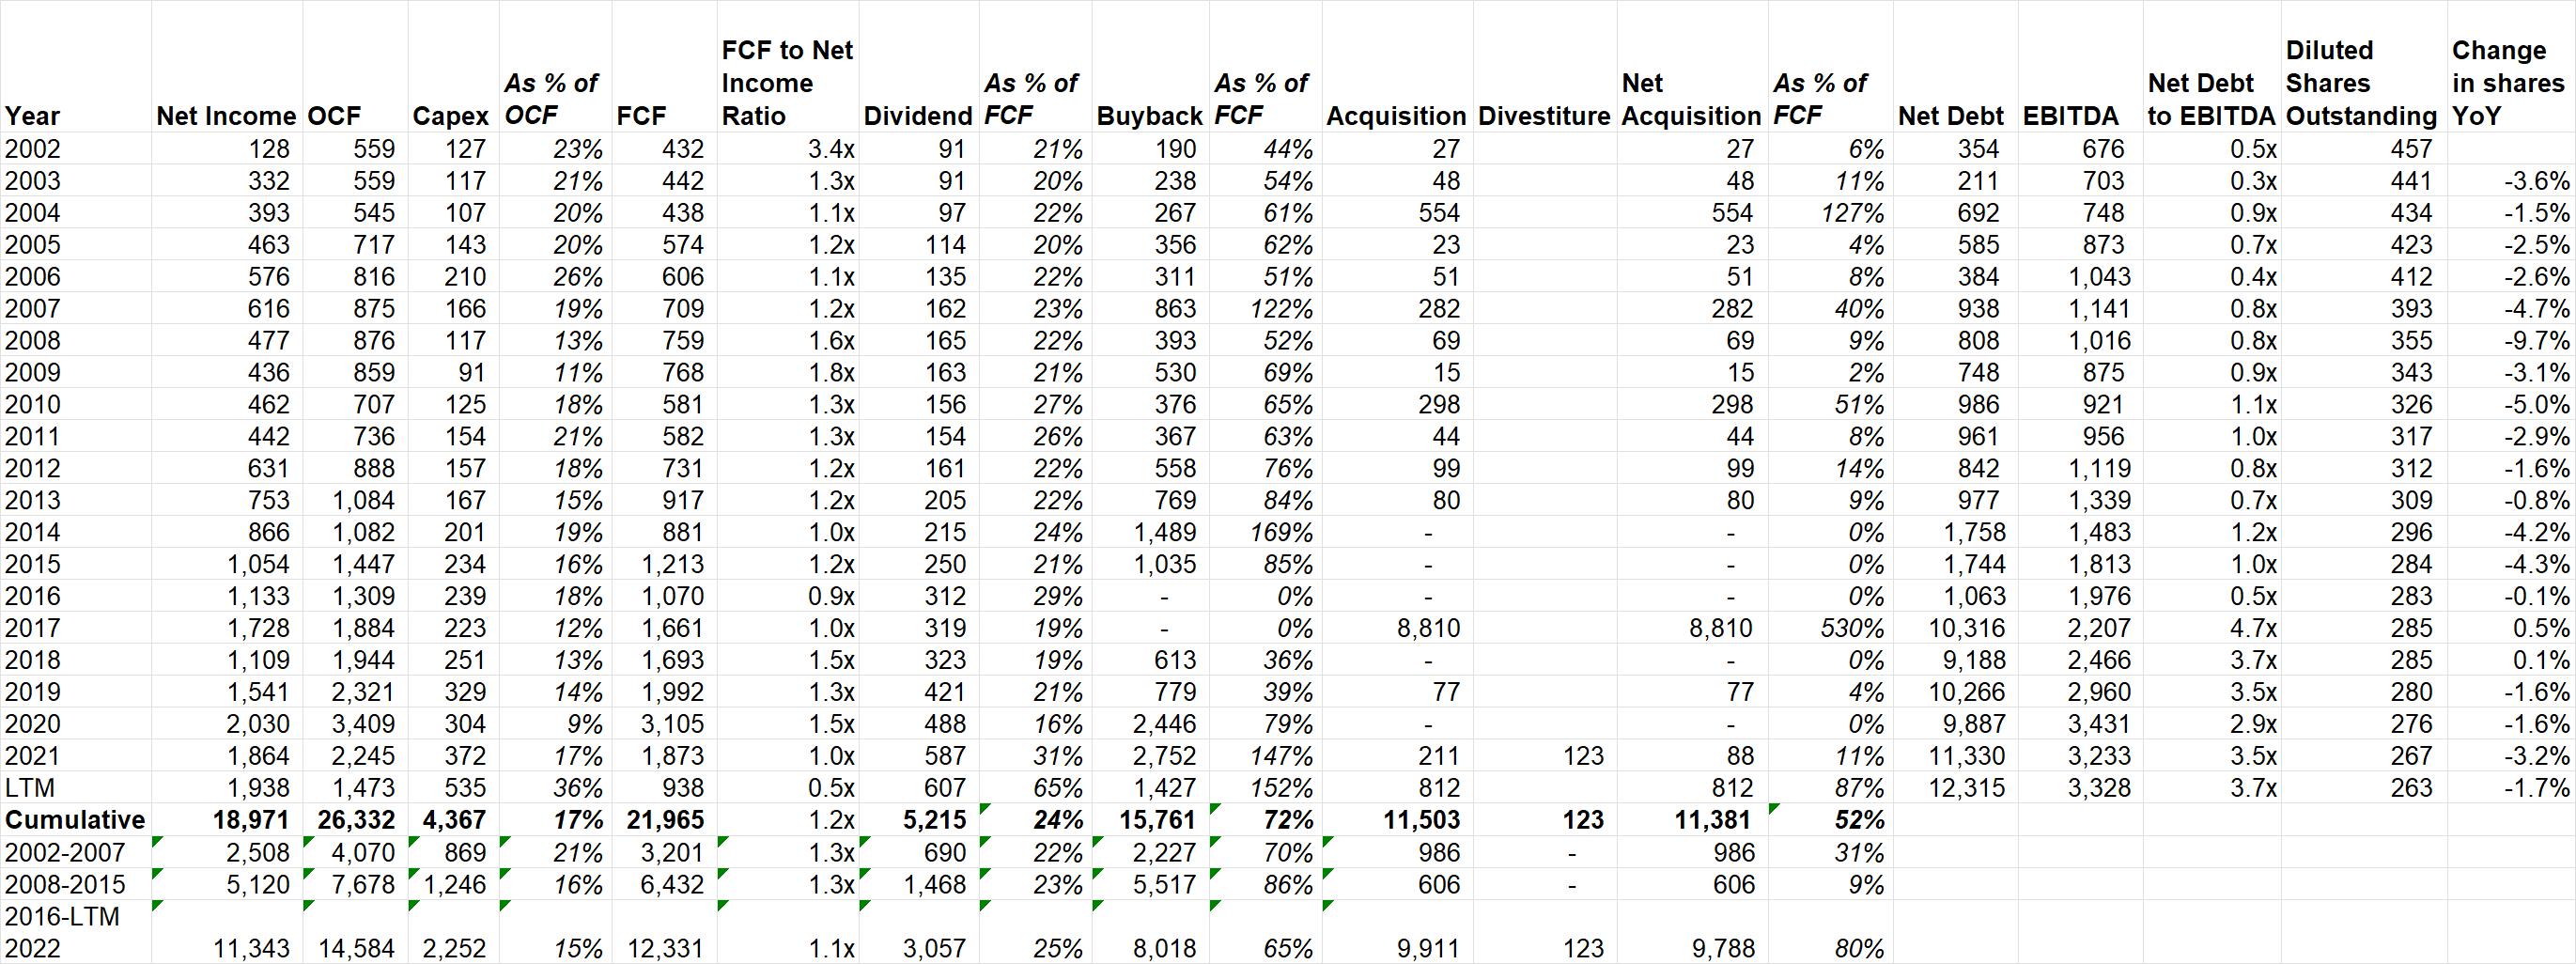
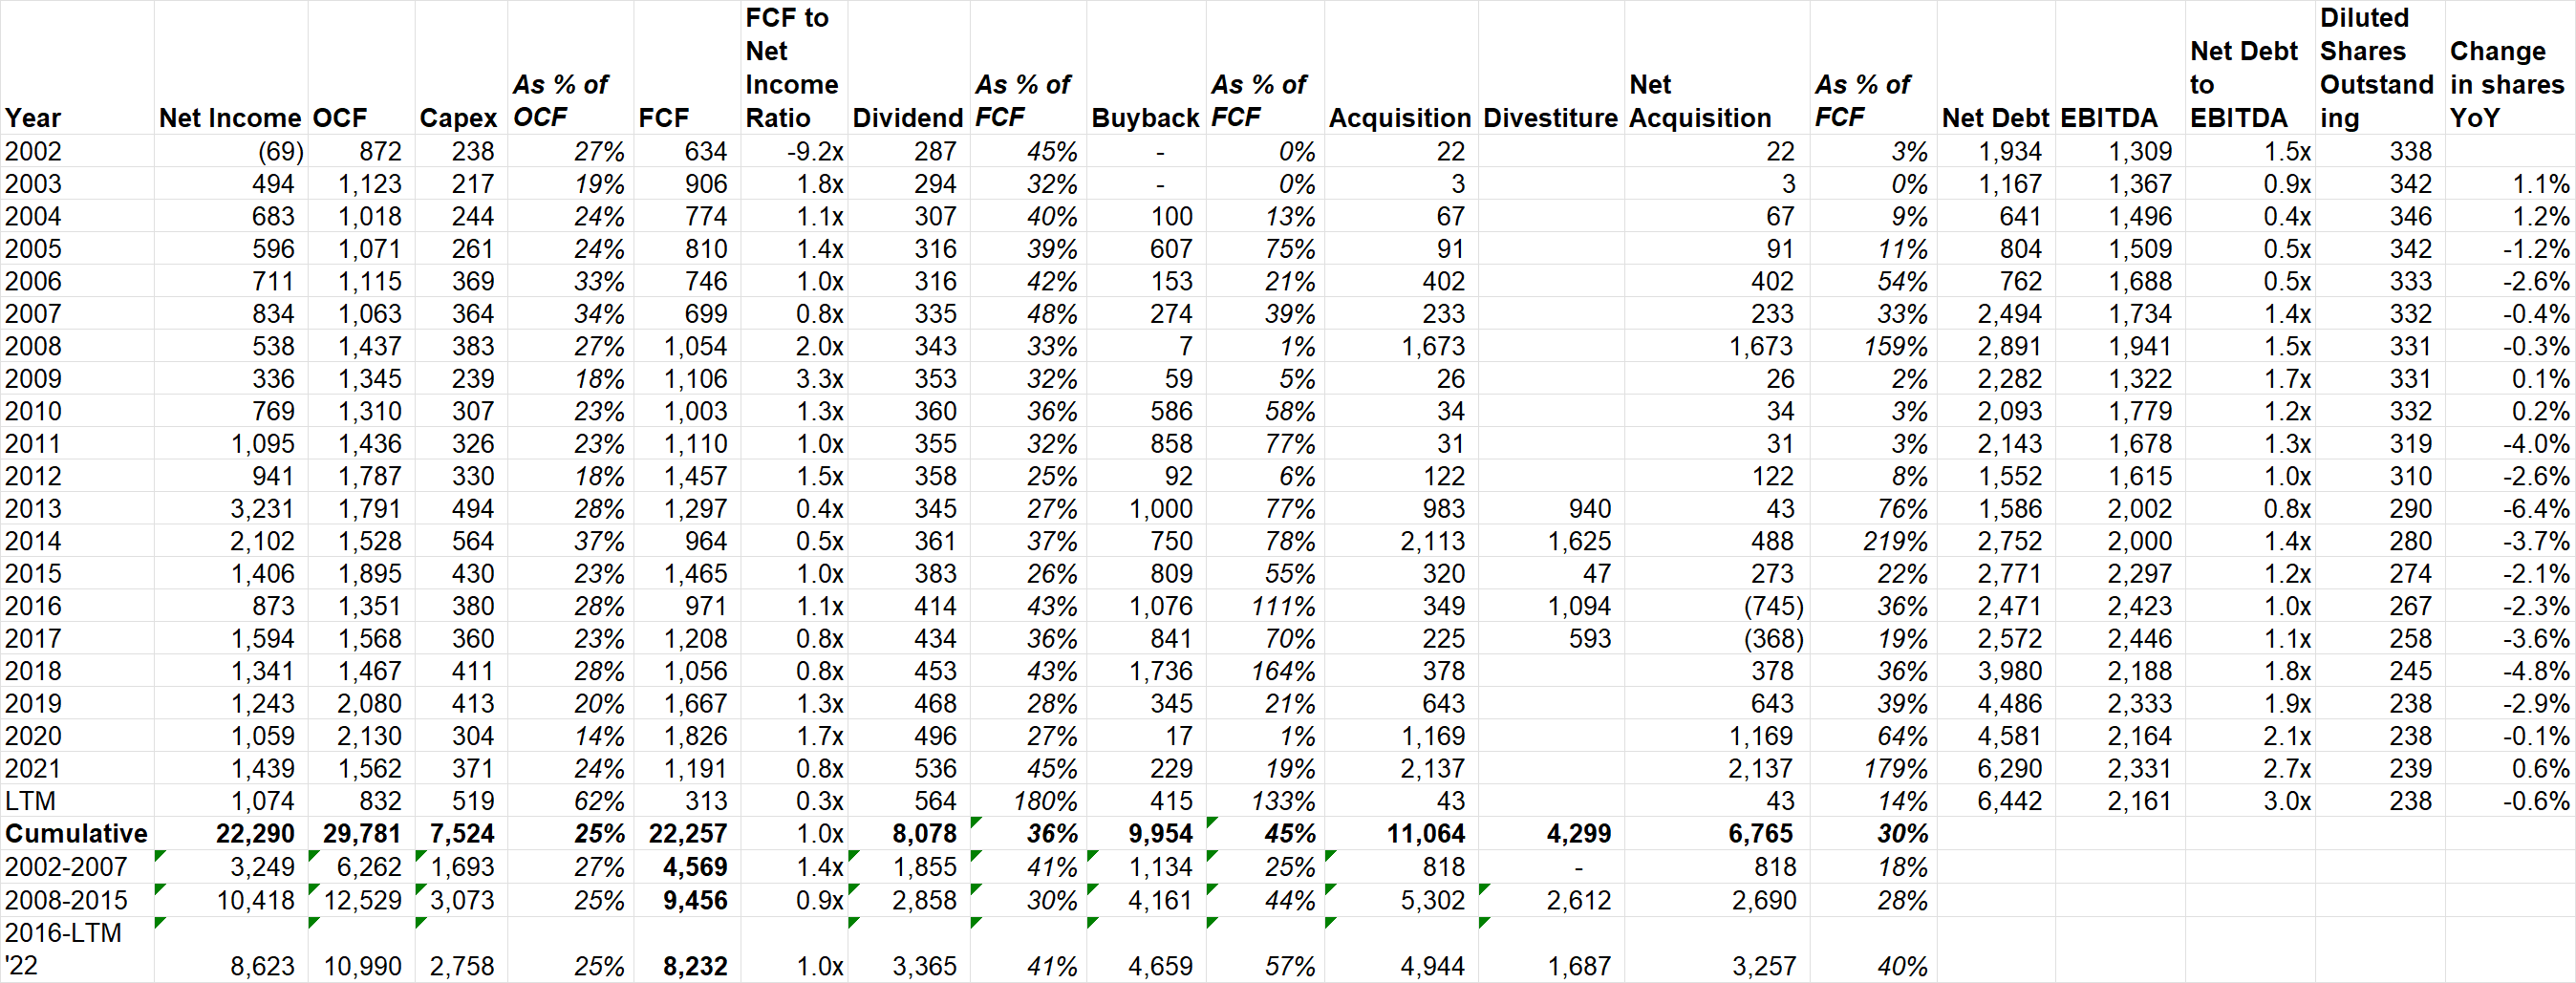
There were perhaps multiple reasons for the divergence of their respective fates, but capital allocation is an important part of the story. In the last 20 years, both PPG and SHW generated ~$22 Bn FCF each. First of all, quality of earnings for SHW seems to be better than PPG as FCF to Net Income ratio was ~120% for SHW whereas for PPG it was ~100% (which is still pretty good but not as good as 120%; also PPG's FCF conversion was more volatile than SHW's). In case you are wondering, SHW's SBC was only $1.1 Bn in the last 20 years, which is just ~5% of cumulative FCF.
What is likely to be more important is how those $22 Bn FCF was allocated by PPG and SHW. ~$5 Bn or ~25% of the FCF in the last 20 years was paid as dividend by SHW. On the other hand, PPG paid 36% of its FCF or ~$8 Bn as dividend to its shareholders during the same time.
SHW used ~72% of its FCF or $16 Bn to repurchase its shares in the last 20 years. During this time, SHW's stock became ~35x; just imagine buying stocks almost every year for the last 20 years whose stock chart looks like this (see below)! Shares outstanding declined by 43%; clearly buying back stocks created enormous value for the remaining shareholders. PPG, on the other hand, utilized 45% of its FCF to buyback stocks, declining ~30% of its shares outstanding over the last 20 years.
Both PPG and SHW also levered their balance sheet much more over time. In 2002, SHW and PPG's net debt to EBITDA was 0.5x and 1.5x respectively. Today, SHW and PPG's net debt to EBITDA is 3.7x and 3.0x respectively. SHW spent ~$11 Bn in acquisition (Valspar is the major acquisition for $8.8 Bn in 2017) vs PPG's $6.8 Bn in the last 20 years. Given the leverage today, both companies are at best likely to do some tuck-in acquisitions. It seems the most likely capital allocation for the next 10 years for SHW will be ~25-30% of FCF paid as dividends, ~60-70% as share repurchases, and the rest for tuck-in acquisitions. If you look at SHW's buyback history, they don't repurchase shares on an autopilot mode; so I'm not expecting this capital allocation to be consistent every year, but over the longer term i.e. 10 years, I still expect buyback to dominate their capital return strategy.
Leverage is likely to be around ~3x over the long run, considering how stable and lindy this industry has proved to be. Please note SHW management mentioned their target debt to adjusted EBITDA ratio is ~2.0-2.5x, but since I'm using unadjusted EBITDA numbers, my leverage number appears to be higher.
SHW Capital Allocation (2002-2022)
PPG Capital Allocation (2002-2022)
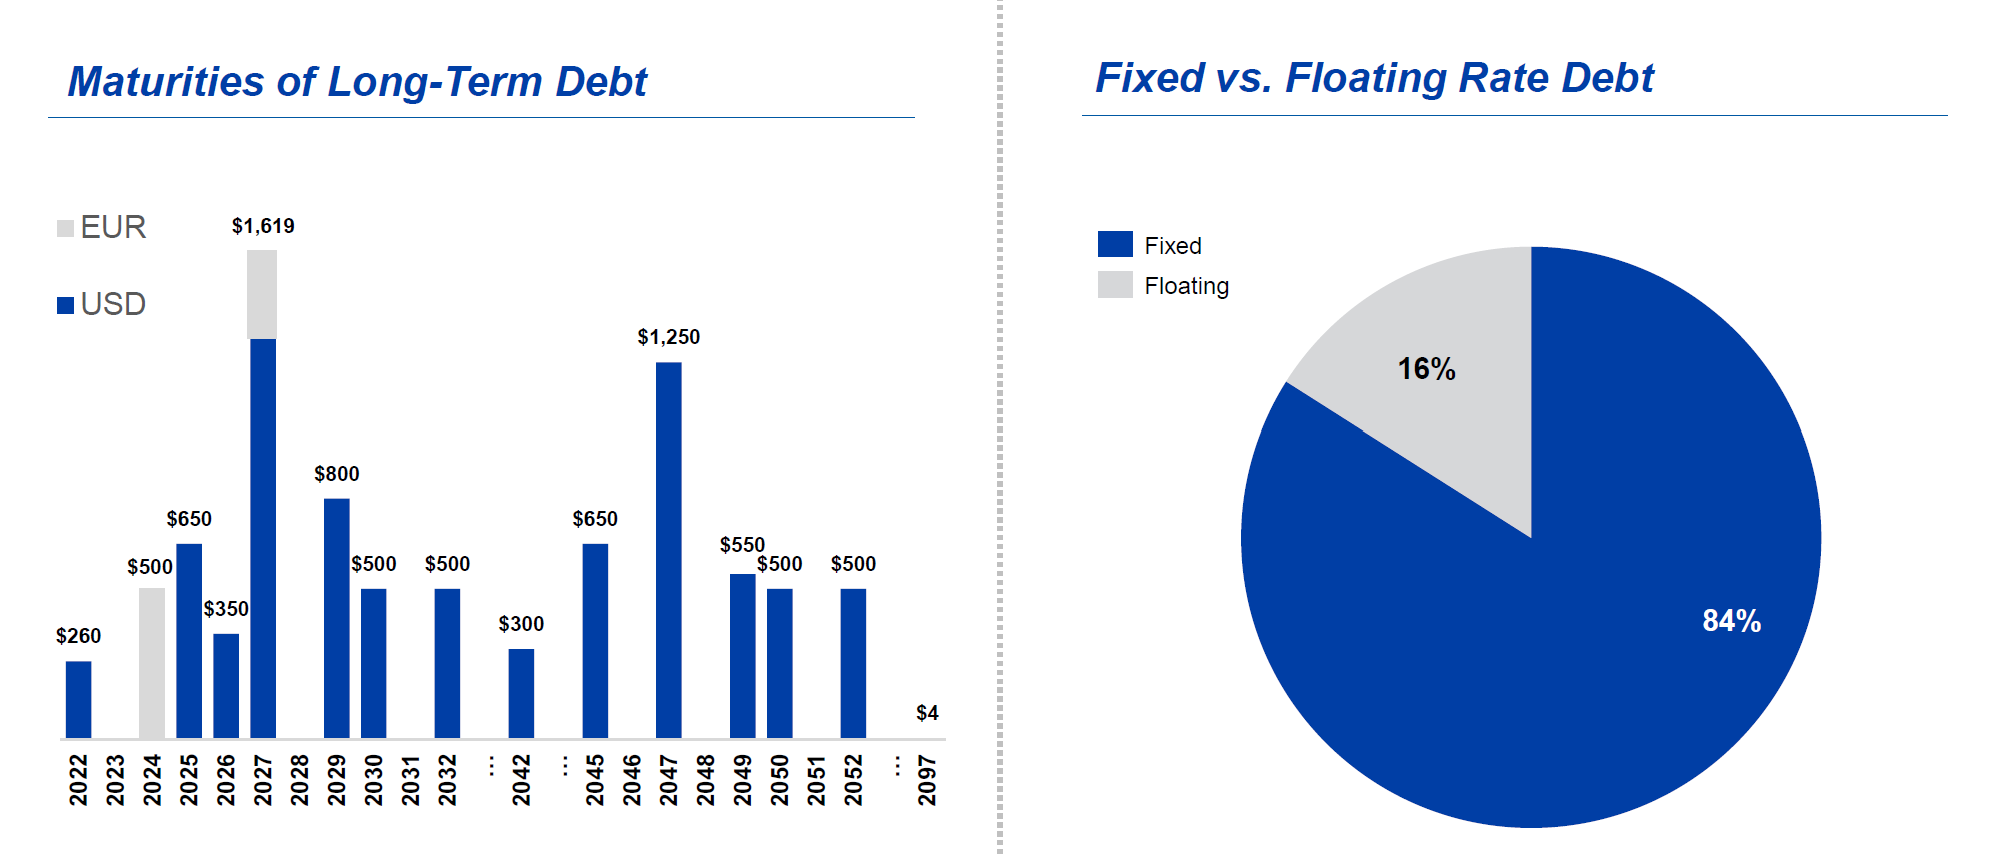
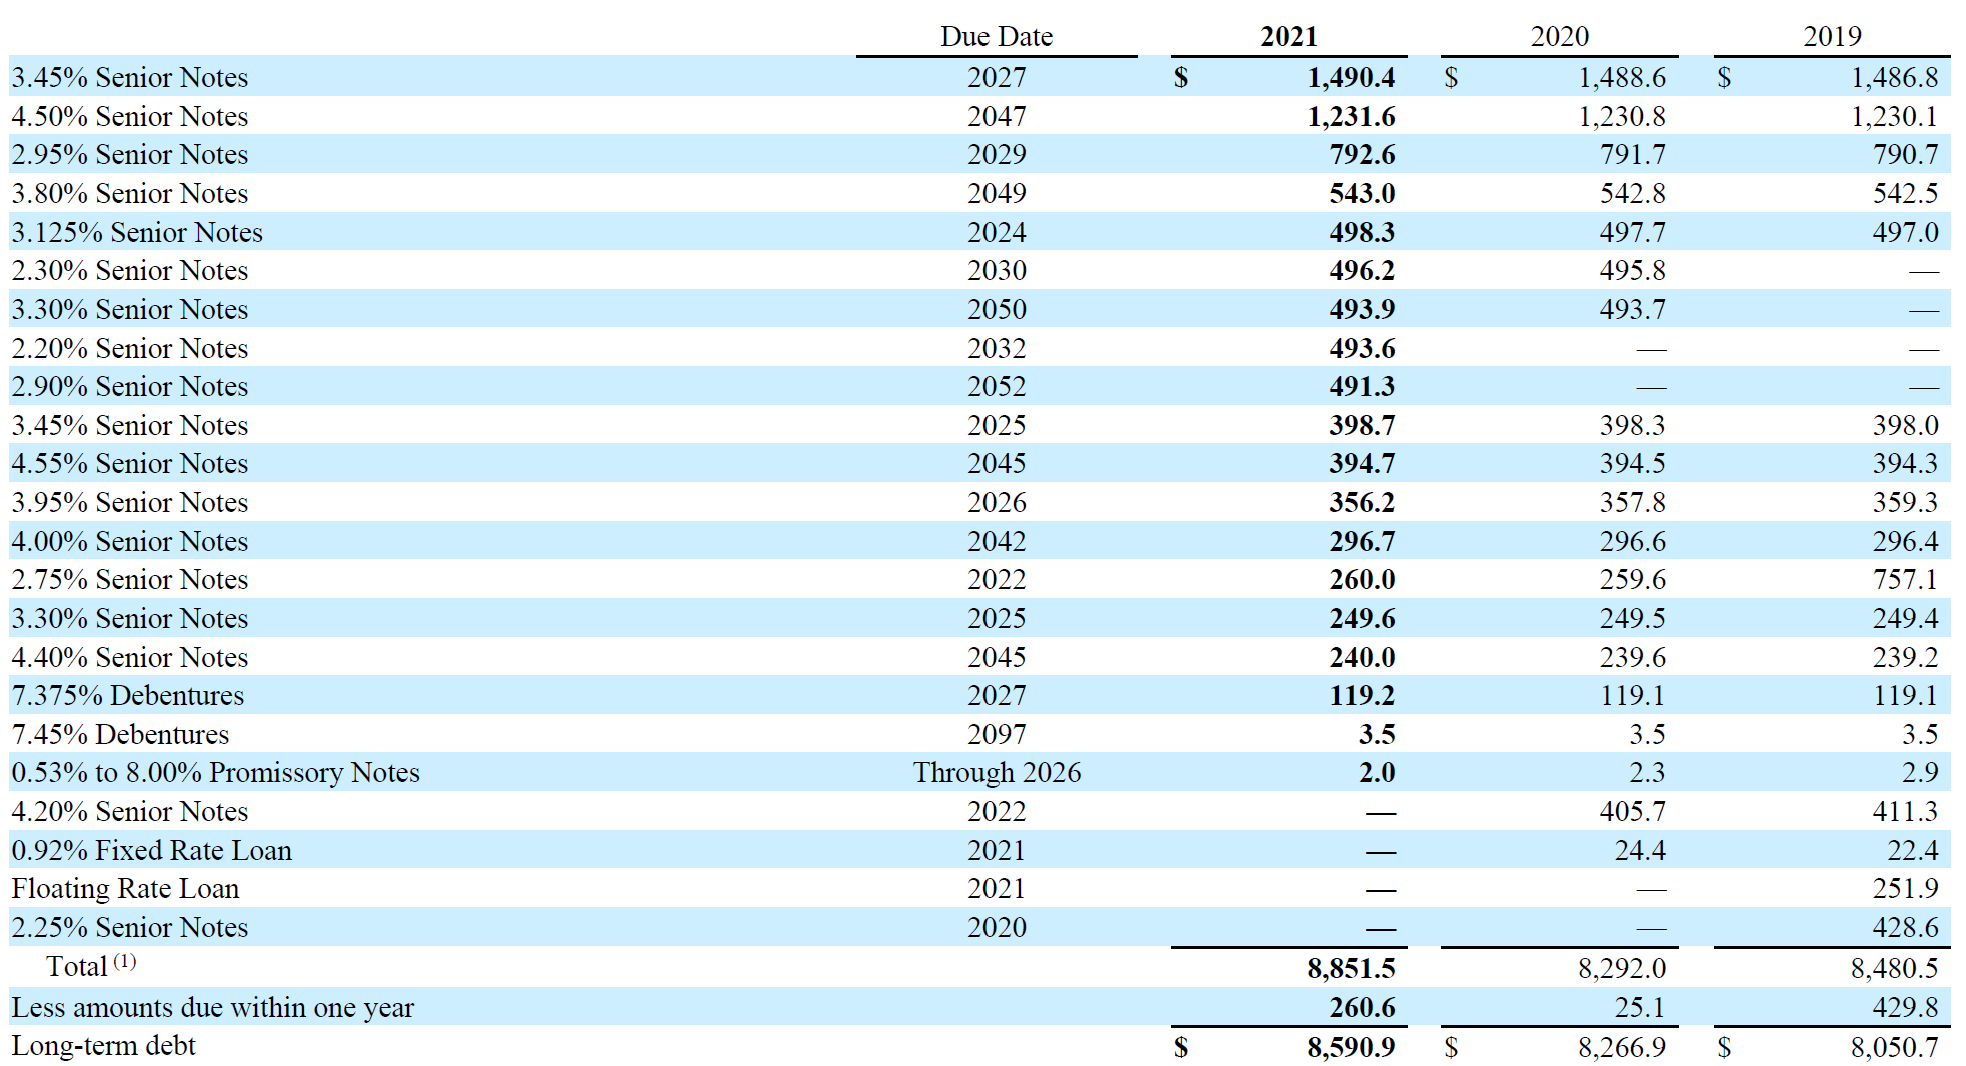
Given the rise of interest rates, one potential concern might be interest expense burden. Fortunately for SHW shareholders, 84% of the debt is fixed rate debt. The effective interest rate for its debt in the last four years was ~3.7%-4%. Given supermajority of this debt is fixed rate debt, I expect effective rate to have a slight uptick, but nothing material to cause any noticeable impact on earnings. Management, in fact, has done an excellent job in issuing bonds last year (see 2032 bonds and 2052 bonds priced at 2.2% and 2.9% respectively); looking at current 10-year yield at ~3.5-4%, those bond issuances is looking like an incredible deal now from SHW's shareholders perspective.
Section 4: Management and Incentives
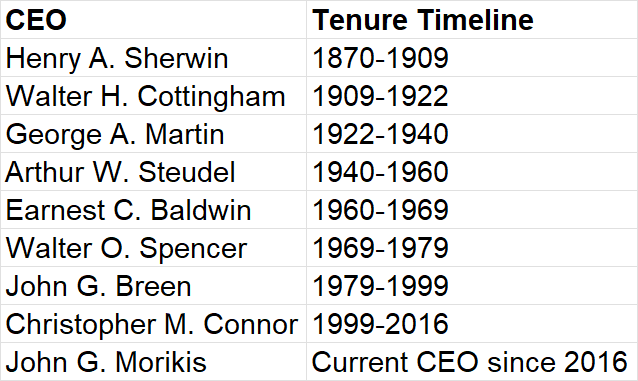
If you haven't studied Sherwin Williams yet and I asked you how many CEOs Sherwin Williams had in the last 156 years since its inception in 1866, I bet you wouldn't guess the answer would be fewer than 10. Indeed, the correct answer is just 9. You can probably praise and admire one or two CEOs for their long service to Sherwin Williams, but what do you do when everyone does this job for 10-20 years?
I guess Sherwin Williams has been such a good business that you have to be exceptionally bad to ruin it. The difference between average and a great CEO running this business may be only a few hundred basis points CAGR which can certainly add up for shareholders in the long run, but it's usually not a life and death question as it is for many industries out there.
It's not just CEOs; when I was reading the recent Investor Day transcript, I noticed most top management people have been with the company for a long time. Sherwin Williams initiated Management Trainee (MT) program in 1982 and many of the current senior leaders (6 group and division presidents, 44 VPs), including current CEO, came through this program. Last year, Sherwin Williams hired ~1,400 MTs. (side note: right after college, I myself started my career in Bangladesh as an MT at a Bangladeshi commercial bank in 2013. The benefit of such program is that it allows you to be acquainted with people from many different parts of the company and helps you have a holistic understanding of how everything fits in the overall company.)
Perhaps even more importantly, Sherwin Williams' average voluntary turnover for the company is just 7-8% and the company mentioned the number is even lower for store managers and sales reps who are the closest to their customers. These are truly remarkable numbers, especially for a retailer. The relationships a store manager can build in a local area over the years can be quite valuable and might be really, really difficult to encroach for a competitor or a new entrant.
When I looked at incentives of the top management, I noticed both base salaries and annual bonus are paid in cash. Annual bonus depends on different metrics for different people in the Senior Management. For example, CEO's annual bonus is tied with Sales, EPS, and FCF.
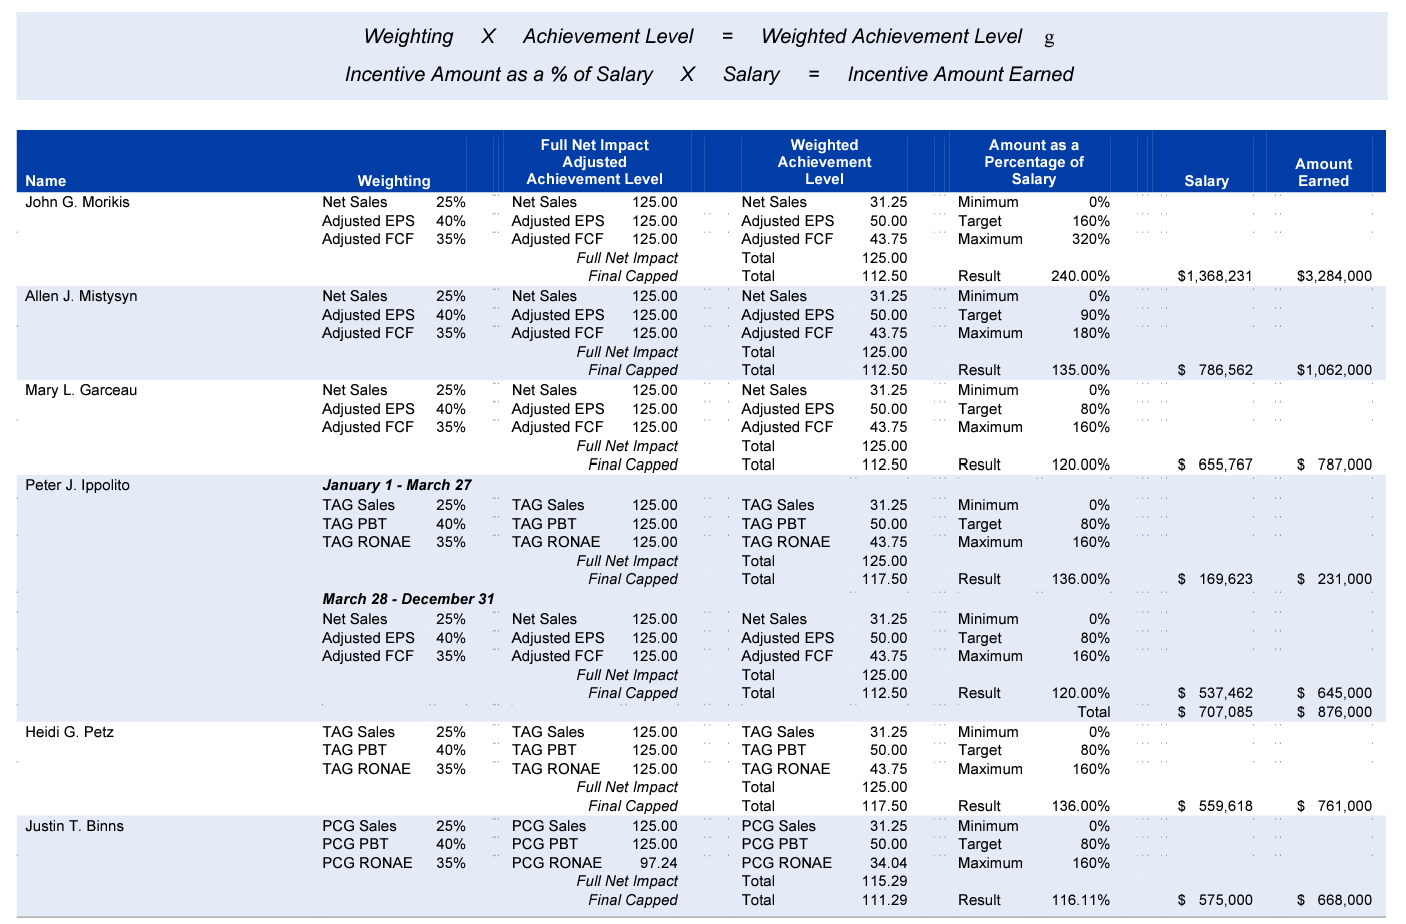
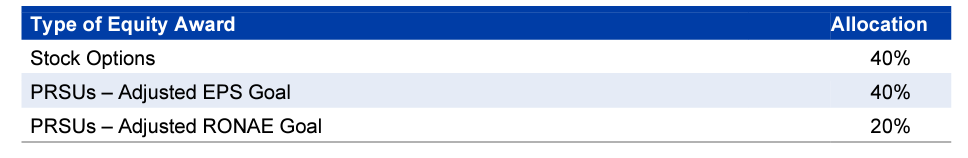
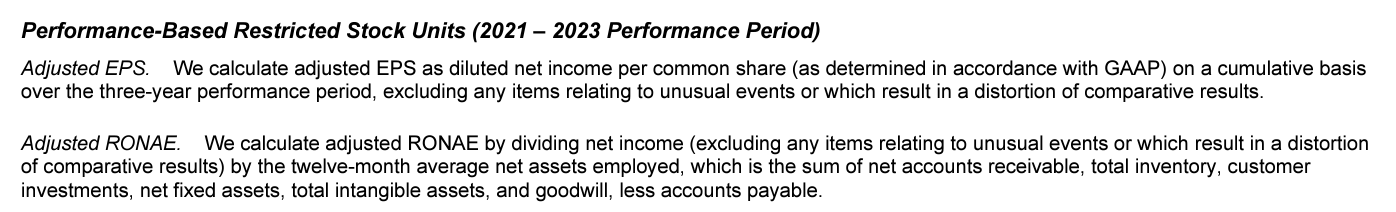
Long-term (3-year) incentives are paid via options (40%) and the rest is Performance RSUs which are related with two metrics: cumulative EPS over 3-year period, and Return on Net Assets Employed (RONAE). Net Assets Employed includes all goodwill and intangibles which may be a good check and balance to ensure management doesn't go for ambitious acquisition spree.
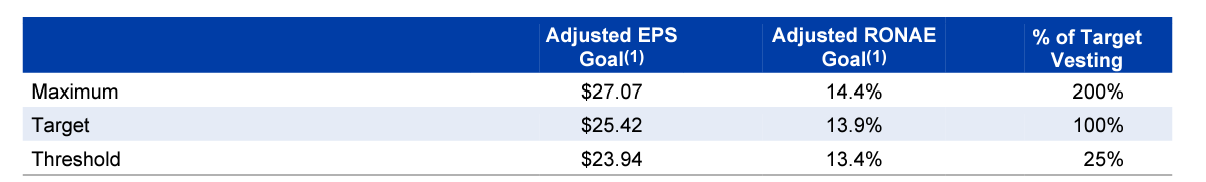
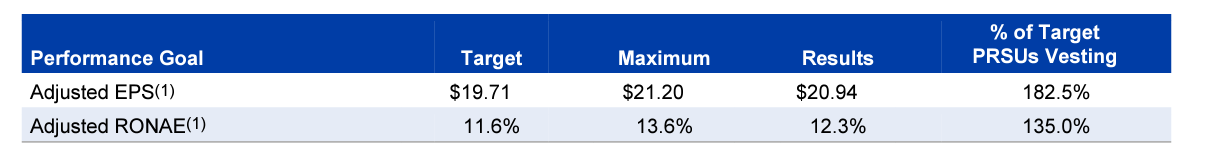
For 2021-23 period, cumulative EPS target is $25.42 and RONAE target is 13.9%. What I like about these goals is they are fairly challenging. For example, SHW's adjusted EPS in 2021 was $7.32; therefore, for management to meet EPS target, SHW will have to post cumulative EPS of $18.1 in 2022-23. Also, 2021-23's RONAE target of 13.9% is actually higher than 2019-21 period which was 12.3%.
Sherwin Williams seems to take a lot of pride in making the decisions for the long-term. If anyone runs a business that's been around for 156 years, that's probably not a surprise:
We are investing in the face, in some cases, adversity while our competitors are making bold moves on their part and perhaps closing stores, territories or other actions. We're going to take advantage of that. And if it takes a little bit of investment that has a good payoff in the longer term, we're going to make those. So I often tell our team, we're not trying to run for the perfect quarter. We've been in business for 156 years. We're looking at the next 156 years.
Section 5: Valuation and Model Assumptions
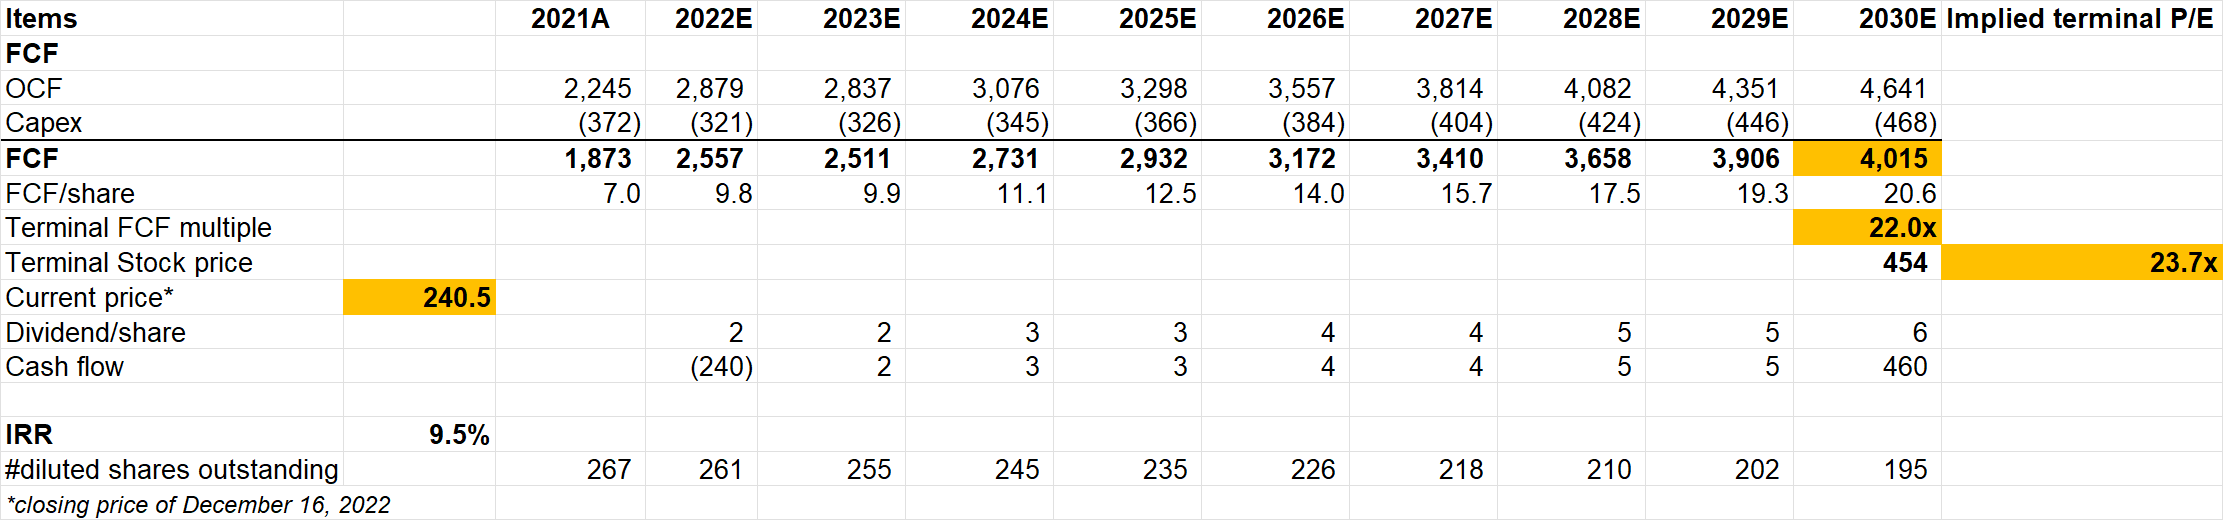
If you are reading my deep dive for the first time, I strongly encourage you to read my piece on “approach to valuation”. Please read it at least once so that you understand what I am trying to do here. I follow an “expectations investing” or reverse DCF approach as I try to figure out what I need to assume to generate a decent IRR from an investment which in this case is ~9.5%. Then I glance through the model and ask myself how comfortable I am with these assumptions. As always, I encourage you to download the model and build your own narrative and forecast as you see fit to come to your own conclusion. None of us have the crystal ball to forecast 5-10 years down the line, but it’s always helpful to figure out what we need to assume to generate a decent return.
Operating Segments
As explained in earlier sections, SHW reports three operating segments (four if you include "Administrative"): The Americas Groups (TAG), Consumer Brands Group (CBG), and Performance Coatings Group (PCG).
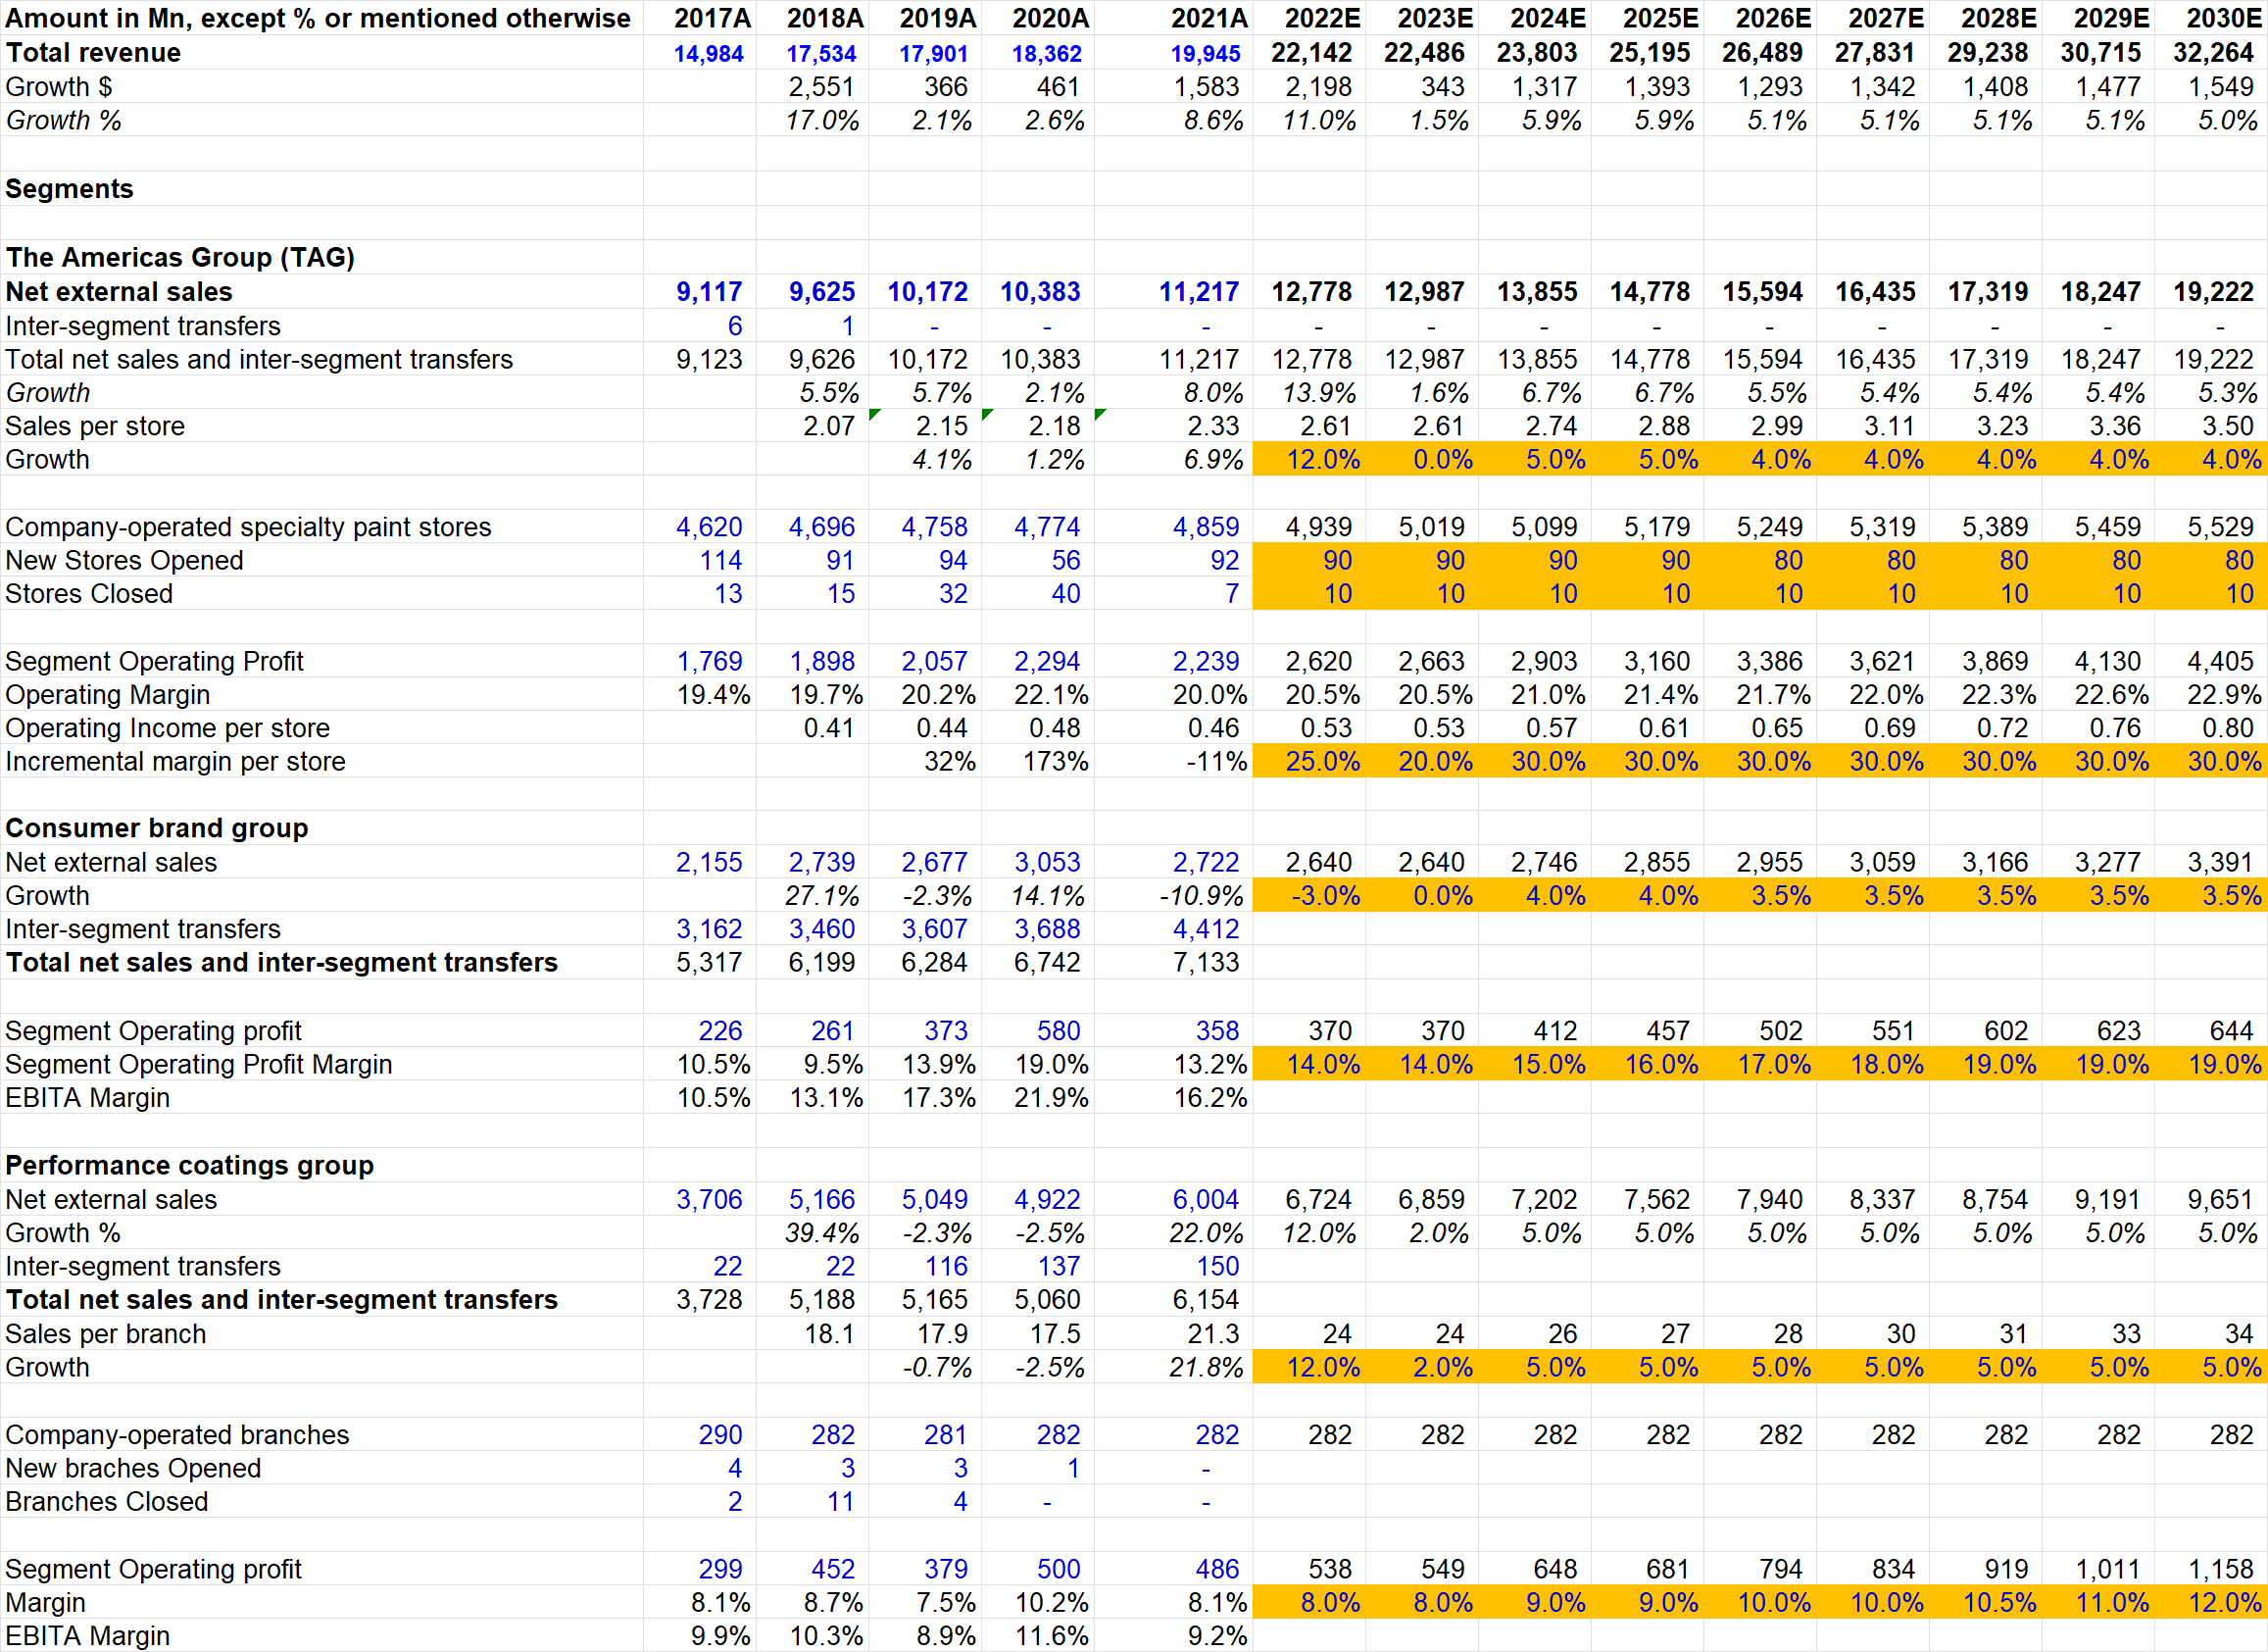
For TAG, SHW's strategy has so far been about opening 80-100 stores every year (excluding pandemic year of 2020). I modeled 90 new stores and 10 closure; therefore 80 net new stores till 2025 and 70 net new stores in 2026-2030. Given the increasingly consensus recession in 2023, I assumed 0% growth in sales per store in 2023 but assumed 5% in 2024-2025. Beyond 2025, I assumed 4% CAGR sales per store. Overall, TAG is modeled for MSD sales CAGR in this decade. Management's long-term guidance is, however, more optimistic than mine as they outlined TAG's long-term growth to be MSD to HSD which they think 1.5x-2x of overall market growth. I'm consciously modeling closer to the low end of that long-term guidance since it is possible we may be entering a prolonged economic softness.
The way I thought about growth algorithm is industry volume growth of 1-1.5%+ SHW market share volume gain of 0.5%-1%+ price increases of 2-3%= 3.5-5.5% revenue growth per year.
For TAG operating profit, I modeled 25-30% incremental operating margin which is noticeably lower than historical operating margin of 40-60%. Here too I was slightly conservative to incorporate the rise of e-commerce (and free delivery) which I believe to be less profitable business. Nonetheless, it wouldn't surprise me if this incremental operating margin forecasts prove to be too conservative, especially in the out years when e-commerce matures more over time. While 50-60% incremental operating margin is perhaps a thing of the past, 35-40% may still be in the realm of possibility.
For CBG, I assumed ~50-100 bps slower growth compared to TAG which leads to 3.5-4% topline growth. Since SHW is more focused on own operated stores than independent/national retailers channel, that seems to be a fair assumption.
While management mentioned CBG to be high-teen to low 20s operating margin business, I was more conservative given the historical numbers. CBG's highest operating margin in the last 5 years was 19%. While last year's margin was affected by raw materials and supply chain related issues, I assumed a more gradual recovery in margin which is modeled to peak (and stay flat) at 19% in 2028 and beyond.
For PCG, after a slower growth assumption of 2% in 2023 due to macro factors, I modeled 5% sales CAGR for the rest of this decade. SHW management also mentioned this to be "MSD growth business, including acquisitions" which makes me think we are likely to see more acquisitions in this segment going forward. My operating margin assumptions appear to be slightly more optimistic than what you can see in historical numbers, but 10-12% operating margin seems quite plausible to me as this segment is getting more and more consolidated over time. Moreover, management mentioned "high teens to low 20s" operating margin potential in the long run, but I would like to err on the side of conservatism given the historical performance.
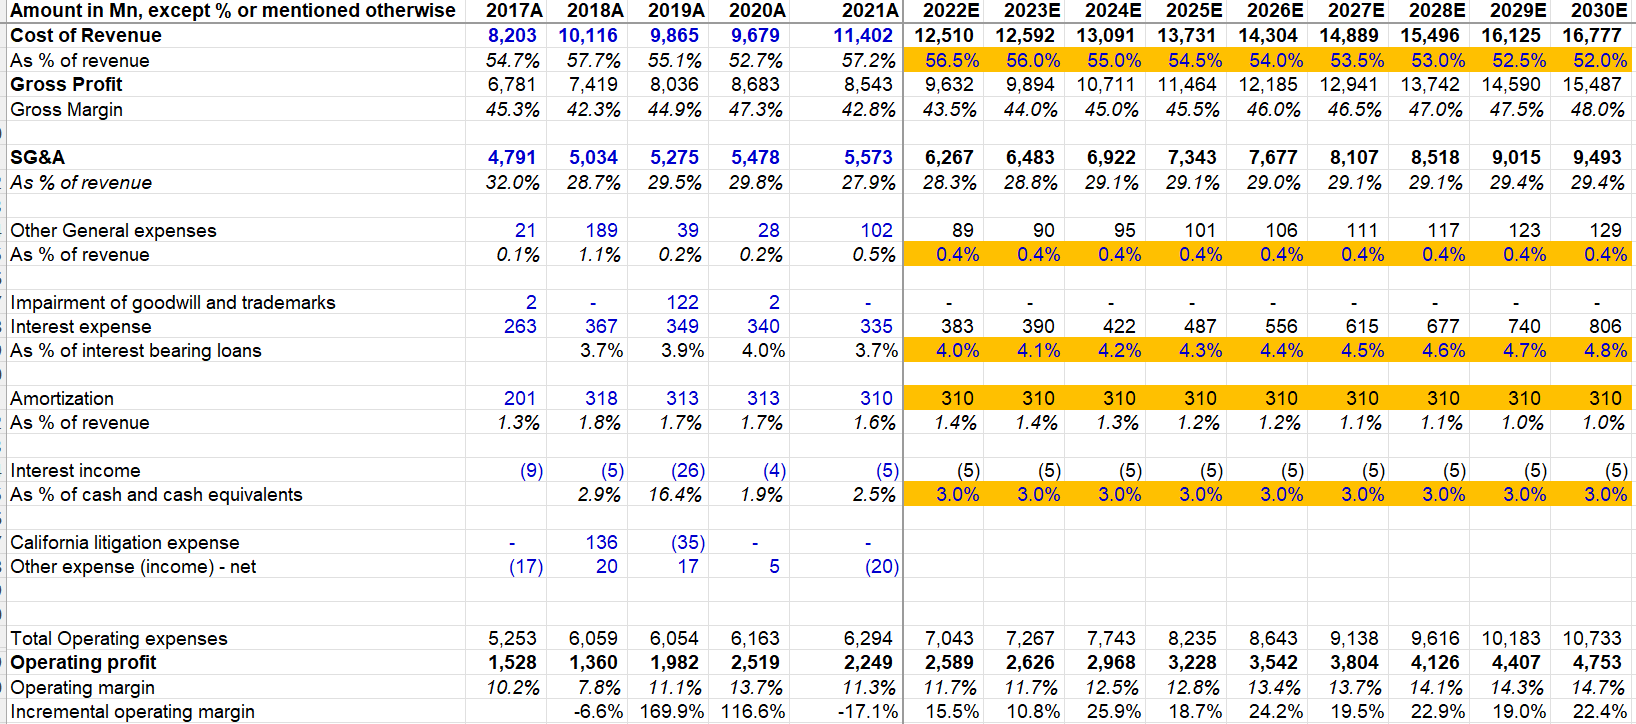
While I explicitly modeled operating margins by each segment, I also wanted to see what my model implies implicitly in SG&A. To understand that, I modeled gross margin for SHW to be ~45-48% (similar to management's guidance which is also in line with historical gross margin). Interestingly, my segment wise operating margin forecasts implies no SG&A leverage at all for SHW which seems conservative to me. Management did mention that they do expect to see SG&A leverage over time:
Although we don't give guidance on SG&A as a percent of sales, you can expect us to consider to see leverage on SG&A over the long term as we grow sales faster than our SG&A increases.
This is perhaps an indication that I could have been a bit more generous in incremental operating margin assumptions for TAG. I'm just laying out a model which I strongly encourage you to play around with the assumptions.
Valuation: To generate ~9.5% IRR, I had to assume 22x FCF multiple in terminal year. Please note I modeled net debt to EBITDA ratio to be 3.1x, set aside $300 mn cash for acquisition each year, assumed 30% of net income to be paid as dividends, and the rest of FCF was utilized to buyback shares in my model.
But what really is the correct terminal multiple for SHW? Is ~22x cheap? or expensive? In fact, it is one of the most common questions I receive from my subscribers. Usually, there is no easy answer. But I'll spend some time in this Deep Dive to explain my framework on how to assess terminal valuation multiples.
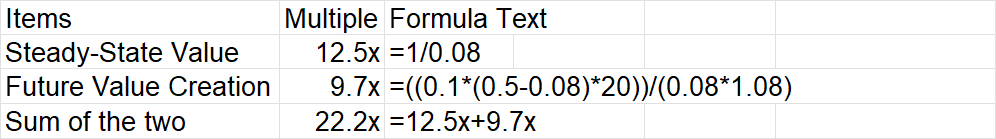
I have shared the following bit from Michael Mauboussin's "What does Price-Earnings Multiple Mean?" before, but let me explain how I like to think about this in terminal value context. I'm not going to take an introductory finance class here, so I'll avoid all the theoretical discussion on cost of capital and will just assume a cost of capital (in this case, just considering equity since we are discussing P/E) to be 8%.
If cost of equity were 8%, the multiple you should pay for a business that is growing at 0% is 1 divided by 8% or 12.5x. That's the steady-state value. But SHW is probably going to grow at more than 0% beyond 2030. How do we value the future growth beyond the terminal year?
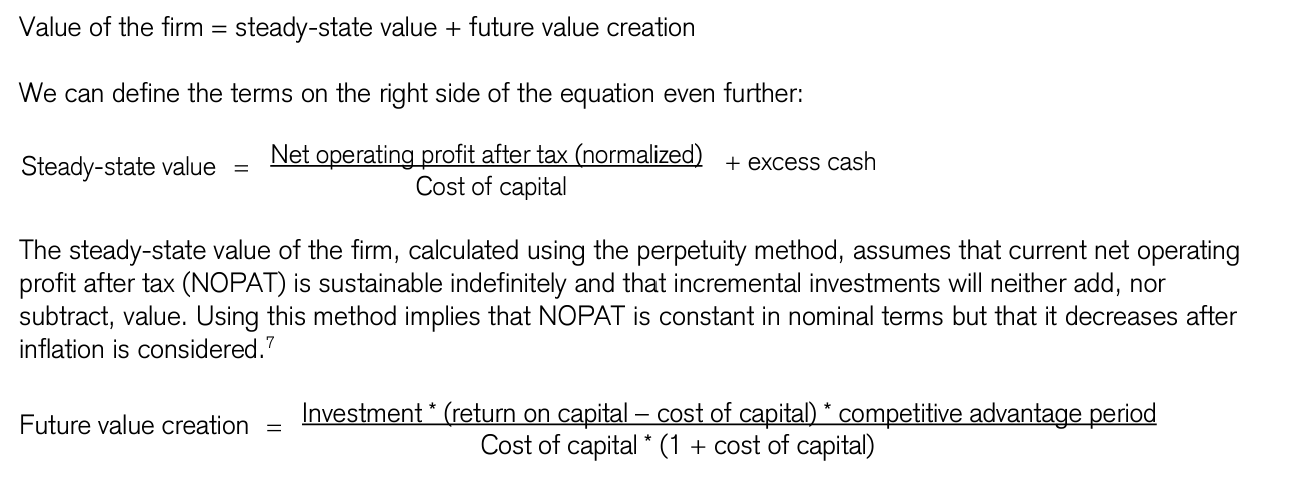
Valuing the "Future Value Creation" is more tricky, but let me give it a shot.
As you probably know by now, SHW is a very capital light business, and there is not a significant re-investment runway left. Beyond 2030, most of its incremental investments is likely to be acquisitions. Let's assume SHW only has runway to invest 10% of steady-state earnings; so reinvestment ratio is 10%.
What's the return on capital? If you see my model's forecasted period in the spreadsheet, you'll see consistently 80-100% incremental ROIC which may seem non-sensical at first. Considering most of the incremental investments beyond 2030 will be acquisitions, such high incremental ROIC may seem unlikely to sustain at first glance. But it is also important to remember SHW's pricing power. Your ability to raise price without any incremental capital invested is essentially a super power in capitalism. SHW does seem to have that as they do pass the cost to customers over time. It doesn't require any capital to do that, but nominal earnings can increase at par with inflation for "forever". Let's say the return on incremental capital is 50% (mostly thanks to pricing power).
Finally, how long will it take for competition to eat away the spread between return on capital and cost of capital? If you asked this question in 1866, the correct answer would be at least 156 years, but of course nobody would take you seriously. Capitalism's tendency is to eat away this spread as fast as possible UNLESS you have some sort of moat that prevents new entrants or competitors to do anything even though they know the profit pool in this industry is substantial. So, what's the correct answer to this question in 2022 for SHW? We don't (and cannot) know for sure, but this is highly competitively advantaged business (e.g. massive distribution and brand leverage). For the sake of this exercise, let's say 20 years. Using these inputs, we can come to the terminal multiple of 22x. What if you assumed competitive advantaged period is 10 years? You would get terminal multiple of ~17x. What if you assumed return on capital to be 10% AND competitive advantage period of 10 years? ~13x. As you can see, the result is very sensitive to the assumptions, but hopefully this gives you a proper framework to think about.
Section 6: Final Words
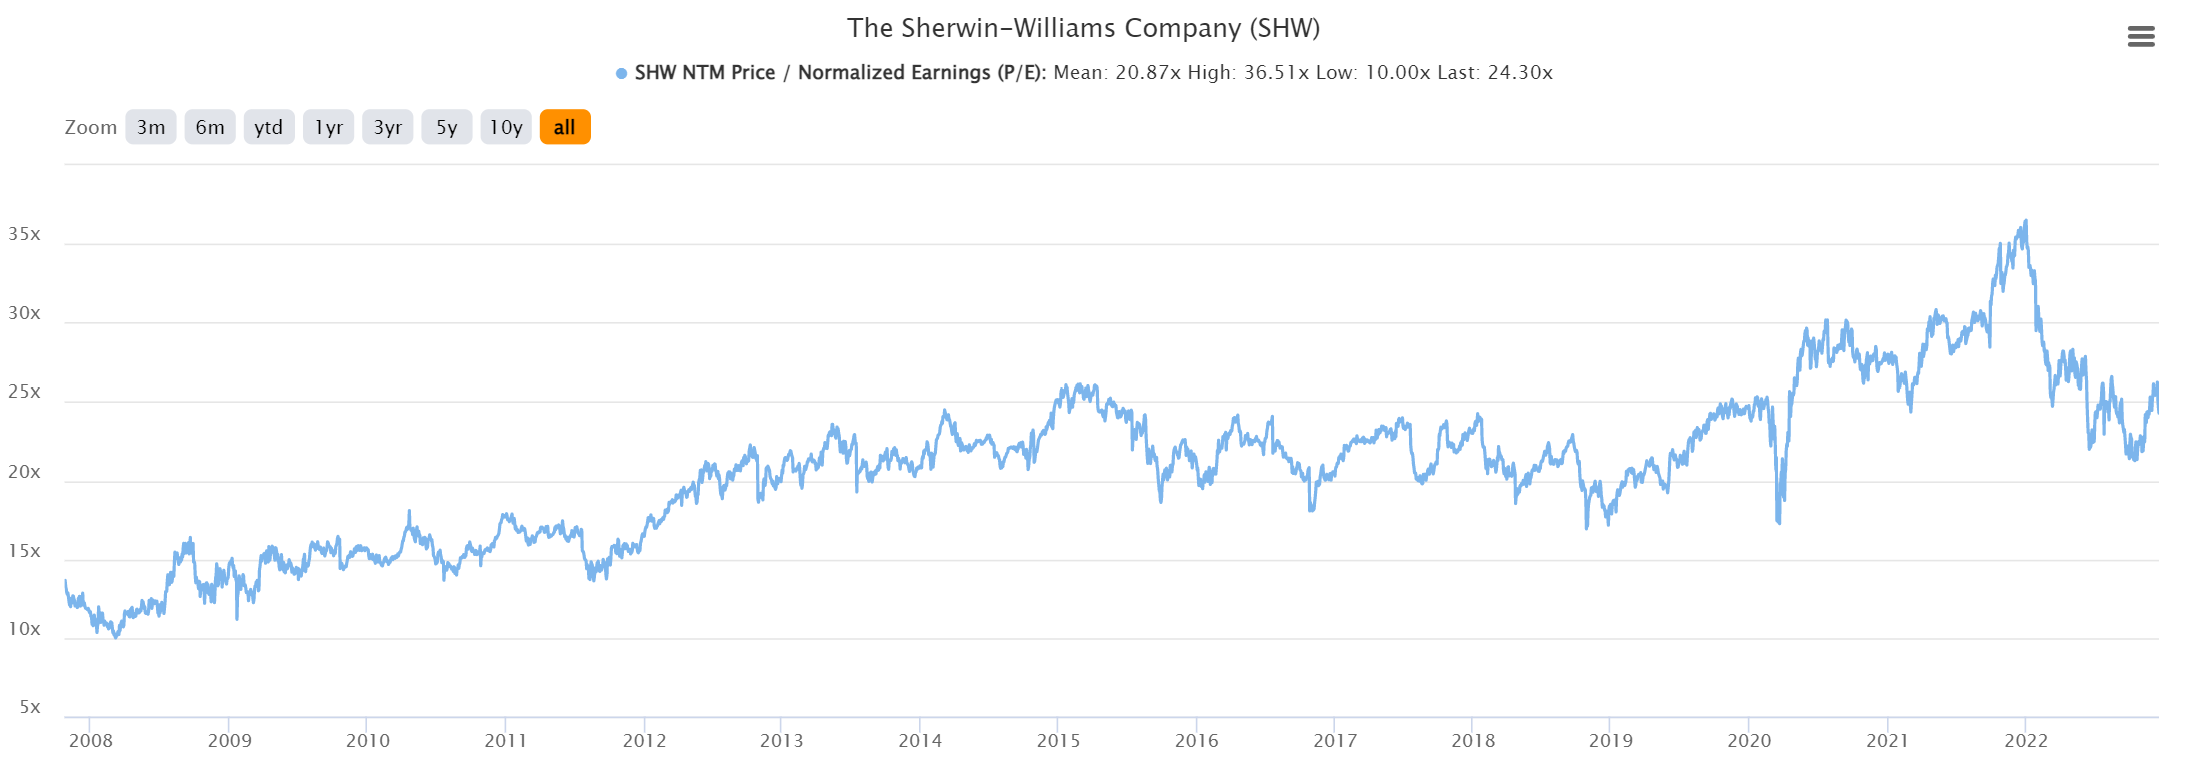
Sherwin Williams is clearly a great business. Capitalism doesn't let you survive AND thrive for 156 years unless you are one. But how about the stock today? The stock currently trades at ~24x NTM P/E multiple compared to the mean of ~20x in 2008-2022. In the lead up to a potential recession, paying higher than average historical P/E multiple seems a tad bit risky to me. But there is a catch-22 in looking at historical multiples for stocks such as SHW. Given that SHW has been such a massive compounder for almost any time period, doesn't it inherently imply market has been consistently wrong in appreciating the moats and durability of SHW? Therefore, to look at historical multiples and proclaim the stock should come down at such and such multiple is probably a logical fallacy if you are interested in figuring out the intrinsic value of Sherwin Williams. So, I am a bit hesitant to label it "expensive". Moreover, it is very much possible that my estimates are a bit conservative, especially if management can deliver HSD topline CAGR for TAG segment and high teens to low 20s operating margin in CBG and PCG segments since my estimates are lower than these guidance.
But if I learnt anything from 2021-22, it may be better to be a little greedy. Buying companies at ~7-10% IRR almost necessitates that your hit ratio is close to 100% which is impossible. I finally took Mark Leonard's words "hurdle rates are magnetic" to my heart in 2022 and I don't want to buy anything that appears unlikely to have mid-teen IRR under my base case. I may still end up with ~7-10% IRR for the portfolio because of the inevitable less than 100% hit ratio and that's fine.