Some thoughts on SBC
I have received quite a few messages and emails on Stock Based Compensation (SBC) over the last few weeks. Two things prompted me to write a separate post on SBC:
a) it is a much more efficient way to respond to messages/emails on this topic, and
b) there still seems to be widespread confusion on SBC. While this isn't going to be a primer on SBC, it will hopefully address most of the questions many of you have.
First of all, a caveat: I am not an accountant or tech industry insider. Most of my understanding on SBC is self-taught through profuse browsing on the internet and talking to other investors and industry insiders. Therefore, if you think I am wrong, I will appreciate your input.
So, let's get into the topic now.
SBC number on Income Statement/Cash Flow Statement is almost always wrong
After the Restricted Stock Unit (RSU) or Performance Stock Unit (PSU), which are the most common form of SBC, are granted to employees and Named Executive Officers (NEO), the value of such grant is recognized in Income Statement. It is important to understand how the value is calculated. RSUs typically have a vesting schedule and the fair value is calculated on the initial grant date under a straight line schedule (or accelerated amortization schedule). For example, let's say you received RSUs of a company whose stock was trading at $100/share on January 1st, 2021. The company granted you $100k worth of shares on that day i.e. 1,000 shares (100*1000=$100k). If the vesting schedule is recognized in a straight line over four years, you will receive 250 shares of the company after each year of employment for the next four years.
No matter what happens to the stock price afterwards, the company will recognize $25k SBC in each of the next four years. Therefore, the SBC number you see in Income Statement/Cash Flow is based on the estimates of cost on the initial grant date.
Now let's say, after your year 1 of vesting, you received 250 shares and you sold them immediately. You are about to receive the next 250 shares after year 2, but the stock had 90% drawdown and is trading at $10/share today (it was trading at $100/share on the grant date). If I ask you what's this 250 shares worth today, you'll obviously say $2,500 (250*10=$2,500), but under GAAP, income statement will recognize $25,000, a whopping 10x more than what it actually is worth.
Of course, this works the other way too. If you receive $100K worth of shares today from this company, you will receive 10,000 shares ($100k divided by current stock price of $10). If the stock becomes 10x in a couple of years, GAAP will recognize $25k expense per year whereas the actual cost of these shares will become $250,000.
The big takeaway is GAAP does an awful job of depicting reality in the period of extreme volatility.
Extreme volatility is far too common for individual stocks, especially for tech stocks in the post-Covid period (at first, extreme upside volatility in 2020-21 and then extreme downside volatility in 2022). However, for steady stocks, GAAP may do a good enough job of informing the actual economic cost of these grants.
This is exactly why I used to disagree with many investors who want to just subtract SBC from FCF each year because the SBC we are seeing on Income Statement/Cash Flow can be severely underestimated or overestimated depending on what's going on in the stock prices after the grant. In other words, the actual economic cost of SBC was underestimated in 2020-21 and highly likely to be overestimated in 2022-2023. Don't be angry why companies' SBC as % of revenue isn't going down in 2022-23 when the SBC that you see on Income Statement may be pretty overestimated.
Look at dilution, right? Sure, but it too is far from perfect.
Since the limitation of SBC numbers we see on financial statements is understood by many investors, many just prefer to look at dilution each year. Unfortunately, this approach too has limitations. While this is helpful, I suspect many investors tend to infer too much information from a specific year's dilution than there actually is. If a company diluted its shareholders by 0.5% or 1% this year, it may not necessarily mean that it is the company's intended strategy to dilute shareholders by 1% or less. It may just mean they are lucky because stock is trading at sky high multiples and they can pay pretty good comp to their employees without diluting shareholders too much.
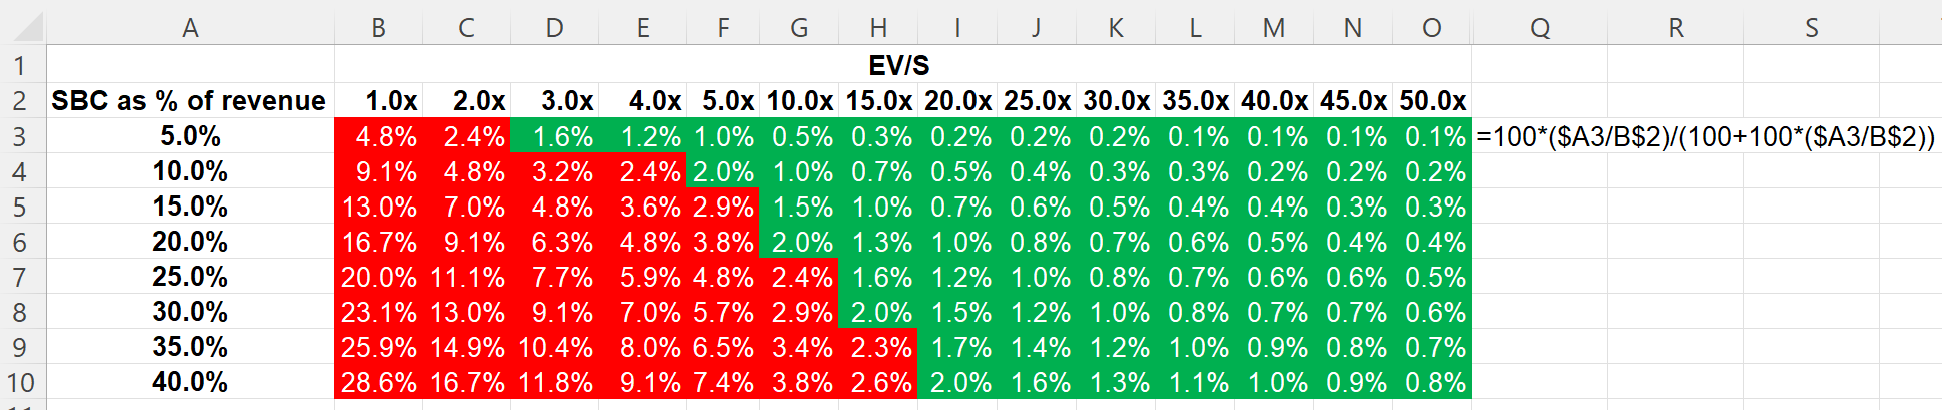
I have shared this table before in my Datadog Deep Dive, but some of you asked for the formula. Please see the formula shown for cell B3. A caveat: I'm ignoring options in this calculation and assuming all SBCs as RSU. There are also other limitations of this table. As I just elaborated to you, the SBC $ number itself can be very unreliable, and therefore, SBC as % of revenue can also be flawed. This is just a good gut check on what sort of dilution is being implied in different multiples and SBC as % of revenue. If you want to calculate dilution, unfortunately there's no easy way other than going through notes to financial statements for each company.
A big question for investors or anyone among tech stakeholders is which one is a relatively fixed number: is it the number of shares offered to employees or the dollar amount of SBC per headcount? I think the answer is likely to prove to be much closer to the latter i.e. relatively fixed dollar amount per headcount but there are nuances to it. I'll explain later with an example.
If you do assume management will continue to pay employees a fixed $ amount of stock every year, GAAP accounting is, in fact, lot closer to reality over the long term than modeling dilution which can be more volatile depending on stock price in any particular year. I know it sounds like a recursive function because it is indeed one. (Note: I received feedback from someone who prefers to remain anonymous based on which I edited this section later after publishing this post)
An example of SBC
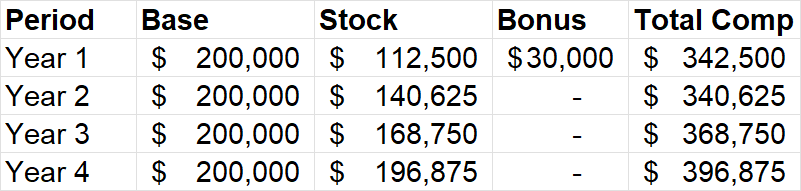
I was discussing SBC with an industry insider recently and here's a rough estimate of how a typical comp is initially structured and how it evolves over time for an employee. Here's an illustrative example for an L5 engineer at Google.
The initial offer is $200k base, $450K stock (vested over 4 years), and 15% bonus on base. Therefore, year 1 total comp is $342.5K ($200K+($450K/4)+(15%*$200K). This employee usually gets a stock refresher after year 1 which is typically ~25% of year 1 stock grant i.e. ~$28K ($112.5K*25%). Therefore year 2 total comp is $341K, and so on. Of course, the actual total comp is dependent on stock price. But none of the tech companies basically thinks about the stock component of the total comp in terms of number of shares, but mostly from the point of view of dollar amount. If they indeed want to dilute the shareholders less, they will have to lower the total comp offered to their employees. Some pressure on tech comp is already underway as annual refreshers, which apparently used to be more or less prevalent, is lately being mostly doled out to top performers. Therefore, total opex per headcount may have peaked at least for 2-3 years, if not longer.
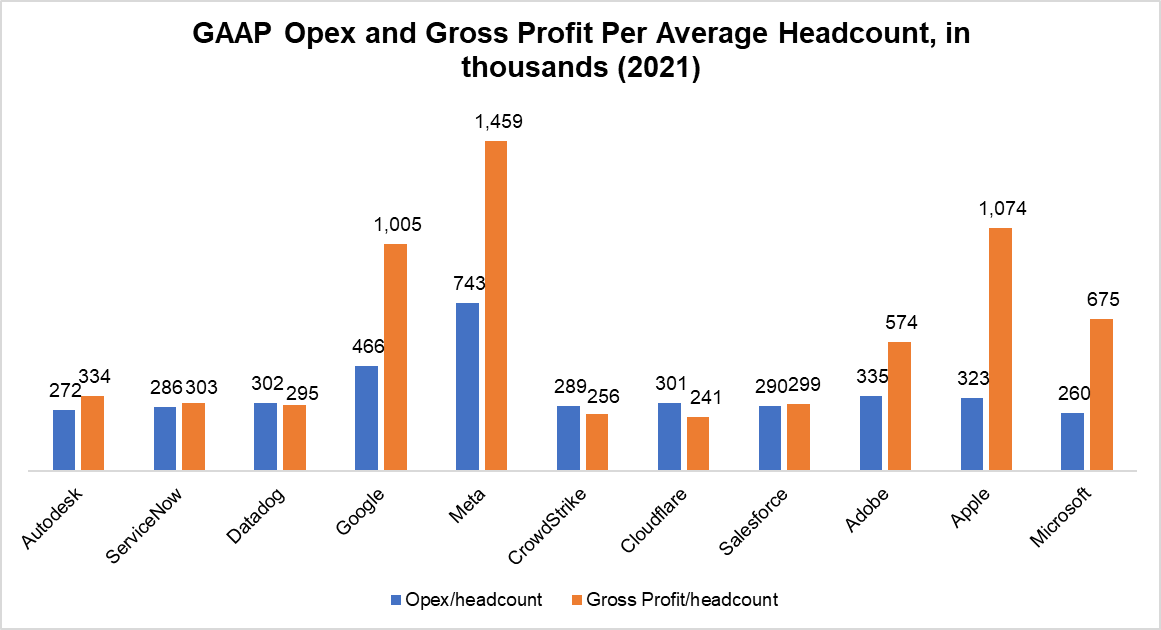
While tech comp may have peaked for the next few years, I am not super optimistic that tech comp will drastically go down anytime soon. In fact, when you look at big tech opex per headcount compared to other tech companies in Silicon Valley, it is hard not to see the material competitive advantage big tech enjoys today in recruiting which may be strengthened during the downturn. Therefore, even though we are likely to see some layoffs here and there by big tech, I will be somewhat surprised if opex per headcount goes down materially in big tech. The reality in Silicon Valley is while the number of "monopolies" are only a handful, today's "monopolies" make sure the cost of "raw materials" to make the next monopoly remains exorbitantly high. It is also perhaps not the best idea for these "monopolies" to show obscene margins when they are being litigated left and right by FTC and EU regulators.
(Please note: ~50% of Apple's employees are related to retail who are obviously not highly paid and hence on an apple-to-apple basis, their opex per headcount may be closer to Google; Amazon has too many warehouse employees to make these comparisons meaningful and hence not shown).
While many tech/software investors are annoyed and even angry at the exorbitant comp packages of Silicon Valley employees, I do not think management of these tech companies are being willfully negligent. I encourage investors to think about how exactly they plan on recruiting engineers and sales people to work on enterprise software companies without being competitive against comp offered by the big tech.
My mistake on SBC (most software investors are perhaps still committing it)
Whether investors admit it or not, in my experience the majority of software/tech investors had a somewhat flawed mental model. I am not criticizing anyone because I made a lot of these mistakes myself. A very common approach followed by investors is just model dilution in interim years and multiply the terminal FCF/share number by a reasonable exit multiple (FCF being Operating Cash Flow-Capex). As I said, I myself followed this approach until June this year. You will see the difference in my earlier and current approach if you download any model before and after June 2022. After a long chat with a couple of followers of mine on twitter and thinking it through, I did come to the conclusion that such an approach does create a mismatch between stock (share count) and flow (SBC) variables which can have profound impact on valuation. In the terminal year, this mismatch can be better approached by deducting SBC from FCF and multiplying the result by a reasonable exit multiple (what is reasonable depends on many variables outside the scope of this piece). On the other hand, if you choose to subtract SBC in interim years as well as in the terminal year, you don't need to model dilution either in interim or terminal year.
Given SBC for most of the software companies is a significant contributor to FCF (often >50%), I do think you would materially overestimate the valuation of these companies if you don't deduct SBC from FCF in the terminal year, an error I think many software investors may still be committing.
Disclaimer: I own Google, Meta, Amazon, Autodesk, and Adobe shares.
All posts on “MBI Deep Dives” are for informational purposes only. This is NOT a recommendation to buy or sell securities discussed. Please do your own work before investing your money.