Meta 3Q'25 Update
Let me start with the conclusion: while Meta’s stock is down ~10% after earnings, the company remains extremely well positioned for the long-term. Meta can, however, still be uncomfortable to own in the short-term as the company is going to navigate pretty aggressive capex plans next year. Nonetheless, I have slept pretty well last night after digesting yesterday’s earnings report.
Here are my highlights from the quarter.
Users
Meta is still adding users to its Family of Apps (FOA). Instagram reached 3 Billion MAUs. Threads, the most recent addition to FOA, now has 150 million DAUs.

Ad revenue by Geography
In 3Q’25, Meta’s slowest growing region was US & Canada, but it grew at 23% YoY! Overall ad revenue growth was +26% YoY which was driven by 14% ad impression growth and 10% ad price growth YoY, both of which accelerated vs 2Q’25. AI continues to be a strong tailwind for both impression growth and improved conversion. Some excerpts from the call:
Across Facebook, Instagram and Threads, our AI recommendation systems are delivering higher quality and more relevant content, which led to 5% more time spent on Facebook in Q3 and 10% on Threads.
Video is a particular bright spot with video time spent on Instagram up more than 30% since last year. And as video continues to grow across our apps, Reels now has an annual run rate of over $50 billion.
For context, here’s how Reels scaled over the last four years:
2Q’22: $1 Billion
3Q’22: $3 Billion
2Q’23: $10 Billion
3Q’25: $50 Billion
Wow, that is some scaling! It may be instructive to remember this pace of scaling when we think about Meta’s monetization of its investments in AI.
How did AI improve Meta’s conversion? From the call:
In Q3, we rolled out Lattice to app ads, which drove a nearly 3% gain in conversions for that objective. Since introducing Lattice back in 2023, along with other back-end improvements, -- we have now cut the number of ads ranking and recommendation models by approximately 100 as we consolidated smaller and more specialized models into larger ones that use the Lattice architecture to generalize learnings across surfaces and objectives. We continue to observe performance improvements as we combine models and expect to drive additional gains as we consolidate another 200 models over the coming years into a smaller number of highly capable models.
we began piloting a new run time ads ranking model in Q3 that leverages more compute and data than our prior models to select more relevant ads. In testing, we’ve seen this new model drive a more than 2% lift in conversions on Instagram. We also significantly improved performance of Andromeda in Q3 and by combining models across retrieval and early-stage ranking into a single model, driving a 14% increase in ads quality on Facebook Surfaces.

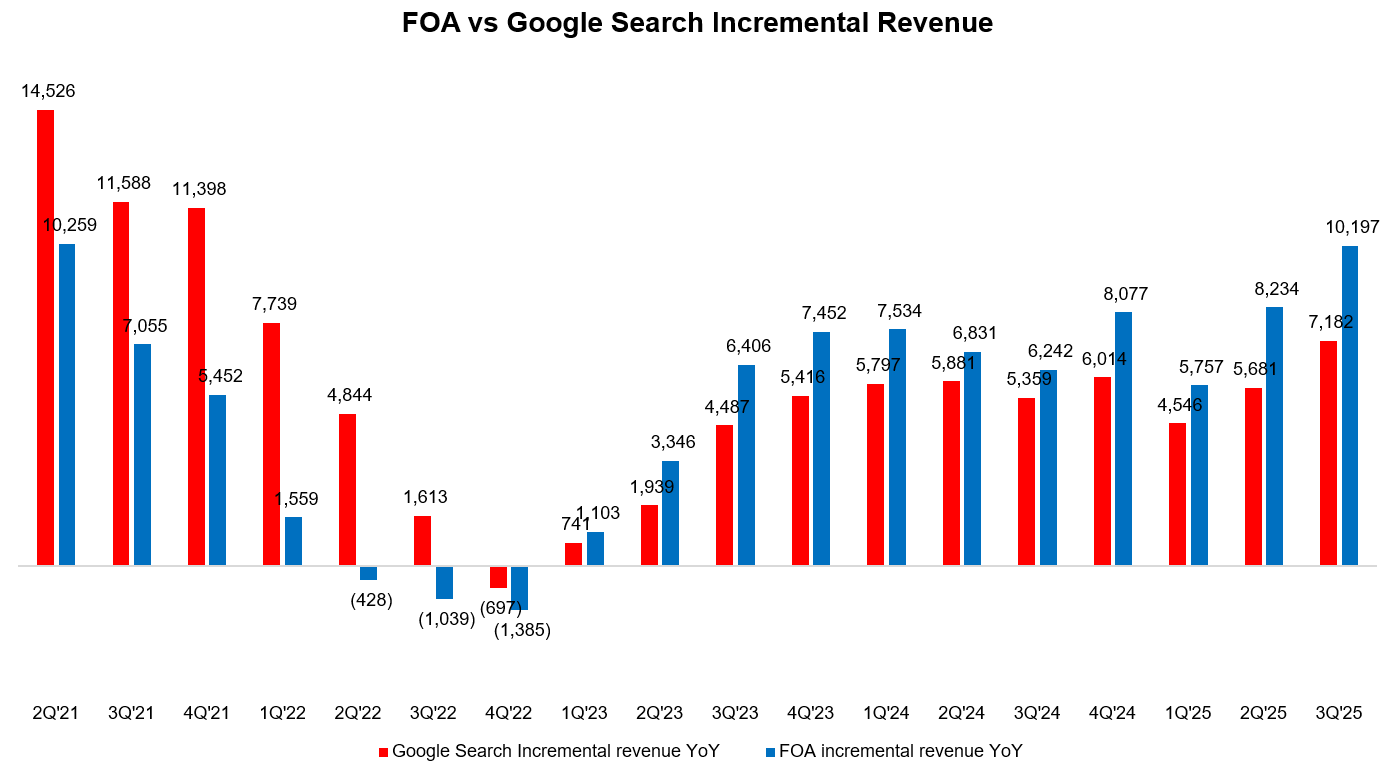
Again, to appreciate Meta’s brisk pace in FOA, you need to compare and contrast with Google Search. In 2Q’25, the delta between Meta’s FOA incremental ad revenue and Google Search incremental revenue YoY was $2.5 Billion. That delta has increased to $3 Billion in 3Q’25. Google Search’s LTM revenue is now just $30.7 Billion higher than Meta’s FOA ads (vs $49 Billion in 4Q’22).
In the last quarter, I wondered if FOA may eclipse Google Search by 2030. At this rate, that may prove to be conservative!
I will cover the quarter in detail and explain my current thoughts on valuation behind the paywall.
In addition to “Daily Dose” (yes, DAILY) like this, MBI Deep Dives publishes one Deep Dive on a publicly listed company every month. You can find all the 64 Deep Dives here.
Segment Reporting