Floor & Decor's Cyclical Malaise vs Structural Moat
One of the ironies of operating in a cyclical end market is that management can sound like genius to somewhat hopeless depending on the stage of the cycle they are in. And if you are caught in the wrong side of the cycle for long enough, investors often start questioning whether this is really just a cyclical downturn or symptom of a rather deep malaise. Of course, if you operate on the other extreme for slightly longer than what a typical cycle predicts, all sorts of secular bull narrative comes at your doorstep.
Floor & Decor (FND) is currently at the wrong side of the cycle and given four consecutive years of same store sales decline (assuming negative SSS in 2026), even the more “settled” bull thesis is under the scanner these days. Even though it was quite consensus not so long ago that FND is a secular share gainer in US flooring industry, if you listen to their Q1 call you will find analysts asking management why they are losing share. Management disagreed that they are losing share. I too received a couple of questions from readers also wondering why FND is in such a persistent negative SSS trajectory while some of the other housing related companies seem to be holding up better. It can be tricky to compare and contrast FND with something like Sherwin Williams (SHW), for example, since even though they can be “housing” related, their demand drivers are substantially different. Ultimately, FND is not in the business of selling paints. What it does sell makes FND currently part of a bad neighborhood. Of course, while looking at market share data, it is more useful if you start from what exactly is going on in their end markets.
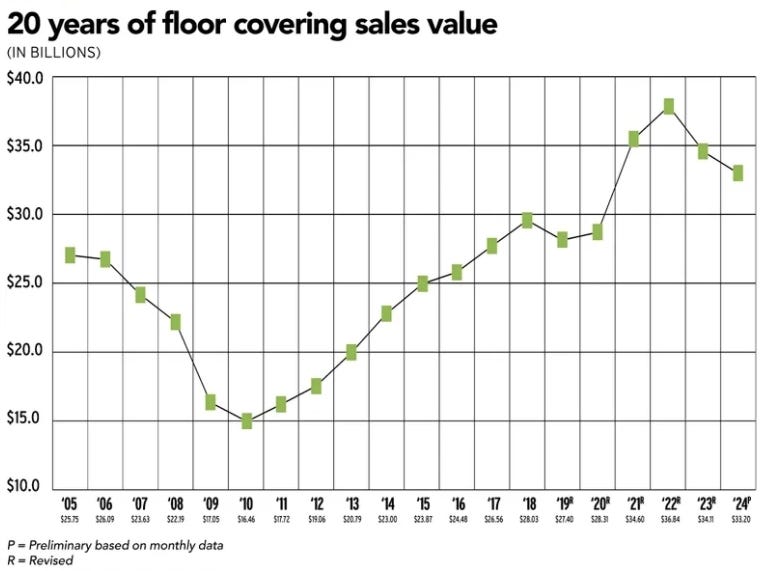
Flooring Sales Weekly reports last two decades of US Flooring sales data and based on the data, we can see the overall US flooring revenue itself declined by 10% in 2024 from its peak in 2022. We don’t have 2025 data yet, but my guess is it declined in 2025 as well.
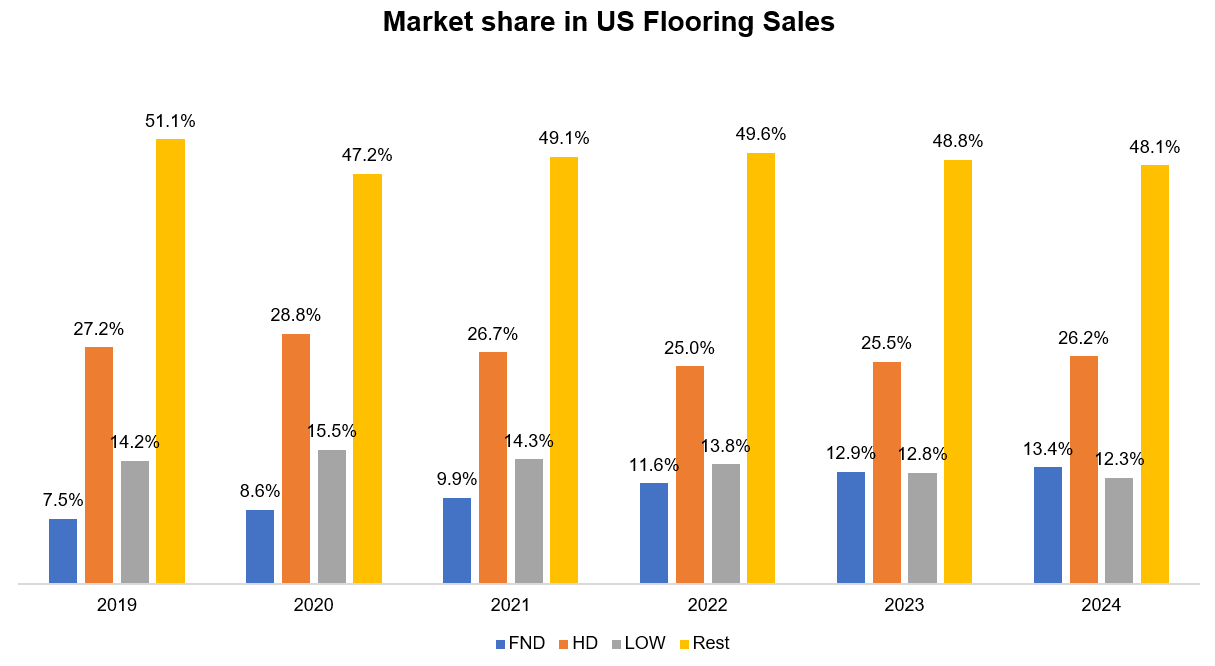
Based on this US flooring industry sales data, we can calculate market share of Home Depot (HD), Lowe’s (LOW), FND, and the rest of the industry. As you can see below, FND’s market share increased from 7.5% in 2019 to 13.4% in 2024. This share gain appears to have come from both the big box retailers and the independents. While HD’s share somewhat stabilized post-2022, LOW and other independent stores continue to donate share to FND.
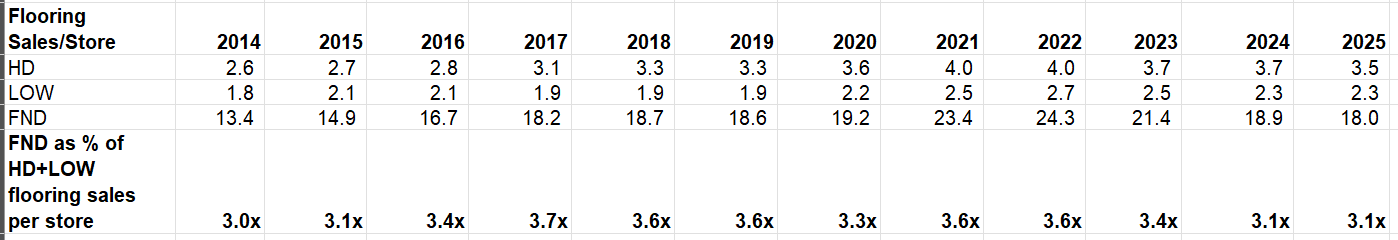
To be fair, FND critics are more focused on per store metrics than overall market share since they believe FND is gaining share primarily via opening new stores. If the new stores cannibalize too much, FND’s economics can deteriorate even if they gain market share. Some cannibalization certainly occurs as FND has broadened its store base from 160 in 2021 to 270 in 2025. However, the problem with store level metrics is it often masks quite a few important nuances. For example, a common observation is even though FND’s sales per store used to be 3.6x of HD and LOW’s flooring revenue combined, that ratio has been going down since then, indicating deteriorating economics on a per store level. However, if you go back a little further and notice revenue per store back in 2014-15 when FND had only one-fifth of its current warehouse base, FND’s revenue per store looks much more stable.
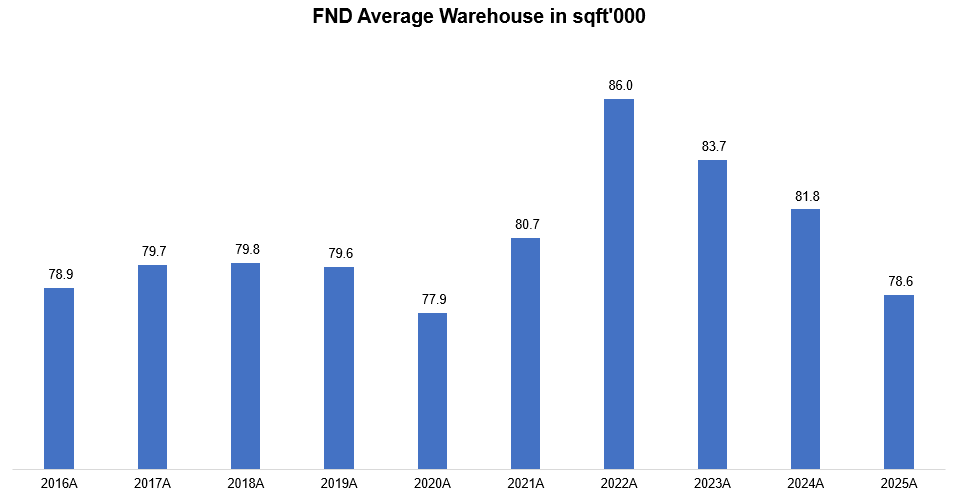
In fact, I think one of the key reasons I think 2014-15 level revenue per store for FND is more indicative than 2021-22 is the evolution of FND’s warehouse size. Back in 2015-16, average FND’s warehouse size was 78.9k sqft which is actually closer to their current average warehouse size in sqft. There was an upward trend in warehouse during 2021-22 period which inflated their sales per store. But in recent years, FND started opening smaller warehouse formats. For example, FND is expected to open 20 new stores mostly in tier 1 and tier 2 markets in 2026 and the average size of these new stores is expected to be only 55k sqft which is noticeably lower than average warehouse size. Why is FND focusing on smaller warehouse formats all on a sudden? Management explained in 1Q’26 call:
“the reality is the 75,000 to 80,000 square foot box isn’t available in those markets. And if it is available, it’s very, very expensive.”
Given these nuances, it can be quite tricky to look at HD and LOW’s per store level metrics and form any conclusion on FND.
Ultimately, big box retailers such as HD and LOW are structurally unable to respond effectively to FND, some of which I have covered in my Deep Dive in the past. However, while discussing FND with a shareholder, I came to appreciate that it may be even harder than I assumed for HD and LOW to compete against FND. The investor explained to me that flooring has unfavorable physical economics for shipping and handling: it's heavy and takes up significant volume (cube) relative to its dollar value. This unfavorable ratio makes flooring supply chains genuinely difficult, and working-capital intensive to operate. It's also why customers prefer close product proximity: shipping flooring long distances to a consumer is expensive, and consumers themselves are making multiple trips, hauling samples, etc. The value-to-cube problem creates a specialized supply chain requirement that rewards focus and scale within flooring specifically and punishes generalists. HD/LOW's supply chains are optimized for a generalist big-box assortment (paint, lumber, tools, appliances, garden, plumbing, etc.) where the average product has very different weight/cube/value characteristics. Their distribution network isn't specialized for the heavy, bulky, lower-value-density nature of flooring. They can move flooring through it, but not as efficiently as a flooring-dedicated network.
So the value-to-cube argument is really a structural argument about why flooring rewards specialization. A generalist like HD/LOW can't justify the parallel build-out for what is 3-4% of their sales, so they remain at a structural disadvantage that compounds with their supplier-side disadvantage (forced reliance on Mohawk/Shaw etc.) and their retail-format disadvantage (3-7k sq/ft departments). These advantages show up in FND’s continued market share gain in overall flooring industry, but that story is entirely masked by the current cyclical malaise.
Subscribers get the daily journal and five+ years of Deep Dives, i.e. full-length analyses with financial models on 65+ companies. The daily is just how I think out loud between the Deep Dives!
Current Portfolio
Please note that these are NOT my recommendation to buy/sell these securities, but just disclosure from my end so that you can assess potential biases that I may have because of my own personal portfolio holdings. Always consider my write-up my personal investing journal and never forget my objectives, risk tolerance, and constraints may have no resemblance to yours.
My current portfolio is disclosed below: