Digital Advertising Industry Snapshot 3Q’26
As I do after every quarter, let me share the snapshot of the overall digital advertising industry. As a reminder, the actual digital advertising industry is larger than what my snapshot below shows, but this snapshot helps me gauge the broader digital advertising industry’s big picture.
As I do after every quarter, let me share the snapshot of the overall digital advertising industry.
As a reminder, the actual digital advertising industry is larger than what my snapshot below shows, but this snapshot helps me gauge the broader digital advertising industry’s big picture. TikTok and Walmart advertising are notably missing here. Well, TikTok is a private company and Walmart doesn’t disclose their advertising revenue consistently.
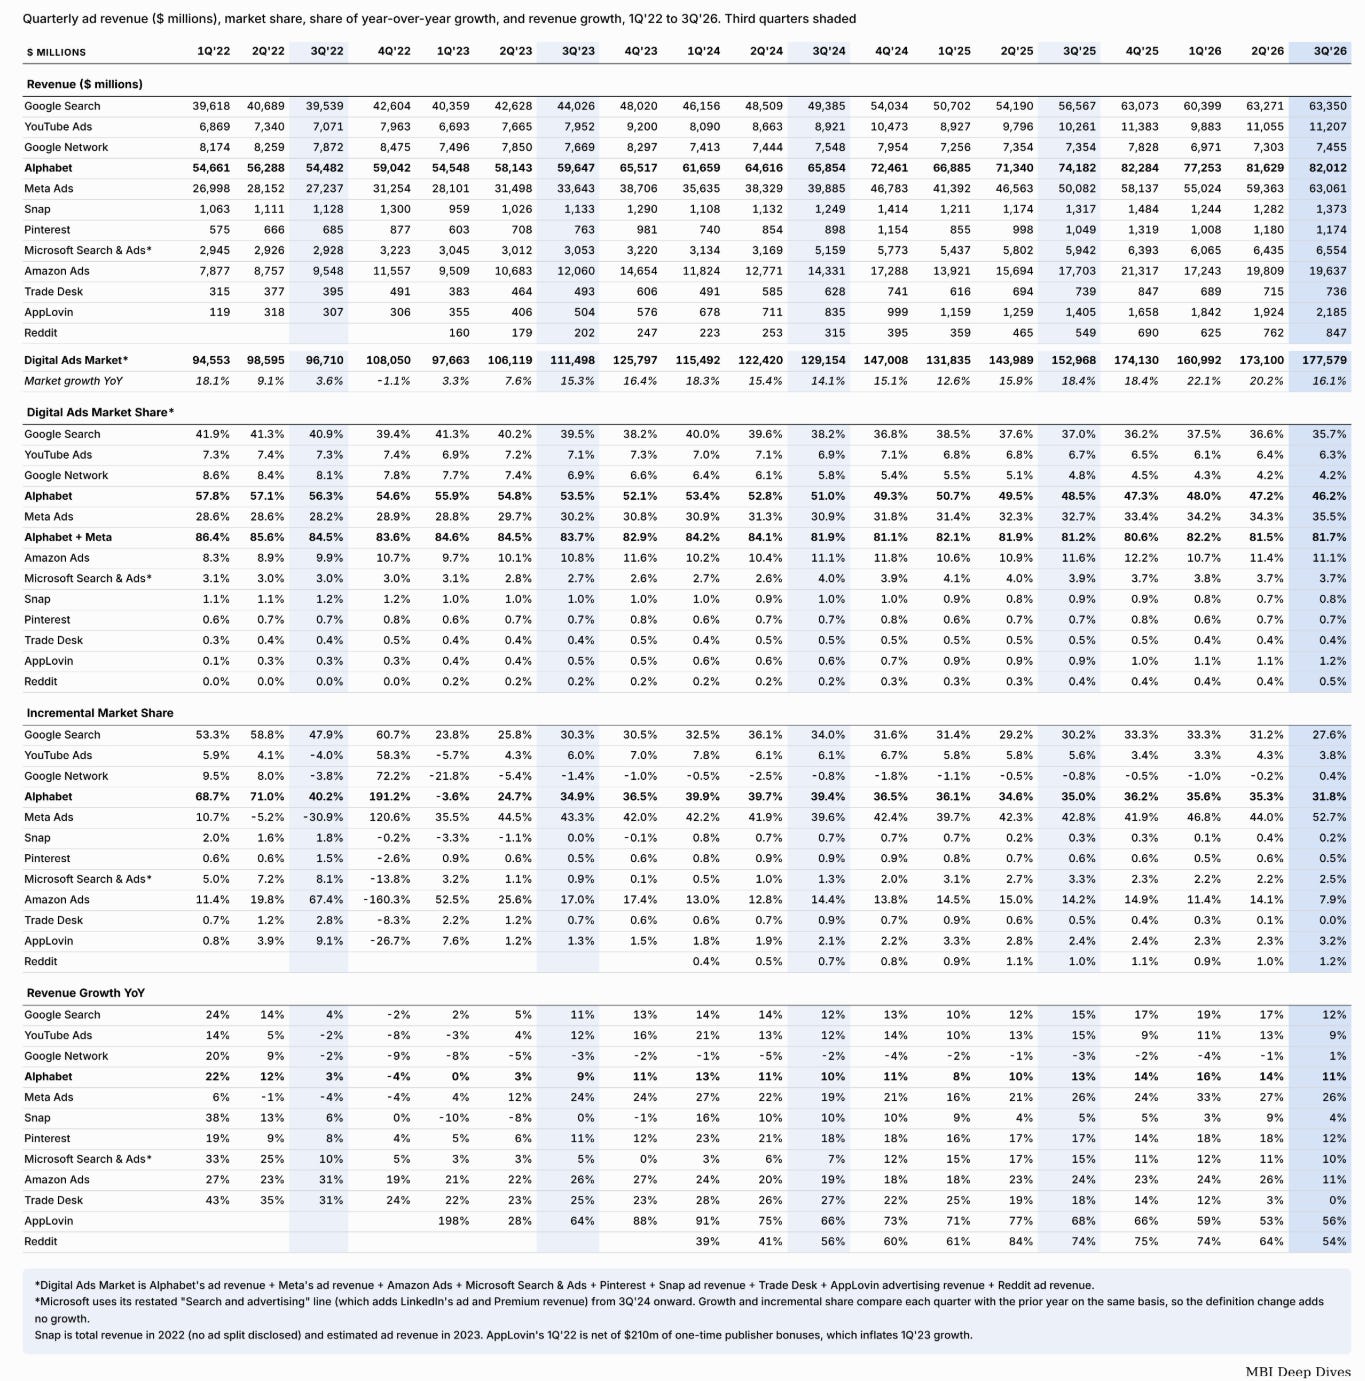
Some key takeaways from 3Q’26:
Digital advertising industry decelerated from 20.2% in 2Q’26 to 16.1% in 3Q’26. As mentioned in my last quarter’s snapshot, given the tough comp I expected both Q3 and Q4 to experience deceleration.
Meta’s incremental share jumped to 52.7%. Outside the ATT-distorted 2022 numbers, this is the first time in this snapshot that Meta captured more than half of the incremental dollar. There is a bit of an asterisk here. Amazon moved Prime Day into June this year, so its ad growth slowed from 26% in 2Q’26 to 11% in 3Q’26, which mechanically flatters everyone else’s incremental share. If I combine 2Q and 3Q, Meta’s incremental share was ~48%. That is still comfortably ahead of its ~35% current share, so the share gain story remains fully intact even after adjusting for the Prime Day timing.
Google Search’s incremental share dropped to 27.6%, the lowest since 2Q’23 (which was again distorted by ATT). Last quarter I wondered whether Search could hold ~30% incremental share or would drift toward the mid-20s. But we need to adjust for the Prime Day impact here as well. On a combined 2Q and 3Q basis, Search’s incremental share was just a tad bit below 30%. Let’s wait a couple more quarters to see if Google Search can stay around this level or keep drifting downwards.
Among the sub-scaled players, AppLovin and Reddit are still punching above their weight, with incremental shares of 3.2% and 1.2% against current shares of 1.2% and 0.5% respectively. AppLovin’s growth actually reaccelerated to 56%. Trade Desk’s revenue declined YoY for the first time in this snapshot, and its incremental share is now essentially zero. Snap (0.2% incremental share vs 0.8% current share) continues to lose relevance.
I should, however, note that some of the definitions of advertising here are not quite apple to apple as some companies report advertising dollar on a gross and some report on a net basis which is why I like to focus more on incremental share data.
I would also like to explain some changes for this quarter’s edition.
Digital advertising industry is defined as Alphabet’s advertising revenue+ Meta’s advertising revenue+ Snap’s ad revenue+ Pinterest revenue+ Microsoft Search and advertising revenue+ Amazon advertising revenue+ Trade Desk revenue+ AppLovin revenue+ Reddit’s ad revenue. Microsoft no longer discloses search advertising on its own, so I now use its “Search and advertising” line, which also includes LinkedIn’s ad and Premium subscription revenue. Microsoft restated this line back to 3Q’24, which is why its share steps up from ~2.7% to ~4% in that quarter. All the growth and incremental share numbers compare each quarter with the prior year on the same basis, so Microsoft gets no credit for the definition change. I also replaced Snap’s 2023 total revenue with estimated ad revenue. For 2022, I still assume Snap’s total revenue as their ad revenue, which is perhaps closer to reality anyway. Reddit’s number has only been included since 1Q’23 since we don’t have their ad revenue numbers in earlier years. Keep these in mind while looking at YoY comparisons in the past. Also note that for visual convenience, I have shaded all the Q3 of the last five years.
Subscribers get the daily journal and five+ years of Deep Dives, i.e. full-length analyses with financial models on 70+ companies. The daily is just how I think out loud between the Deep Dives!
Current Portfolio:
Please note that these are NOT my recommendation to buy/sell these securities, but just disclosure from my end so that you can assess potential biases that I may have because of my own personal portfolio holdings. Always consider my write-up my personal investing journal and never forget my objectives, risk tolerance, and constraints may have no resemblance to yours.
My current portfolio is disclosed below: