What exactly is CSU's ROIC?
Yesterday, I mentioned “While CSU’s heydays of ~50-60% ROIC is clearly behind us, CSU’s ROIC in the last 12 quarters has been quite sticky around ~30% which is plenty good!”
A couple of readers pushed back on how I calculated ROIC and after thinking through their points, I think they are correct in pointing out the shortcomings of my approach. Let me explain.
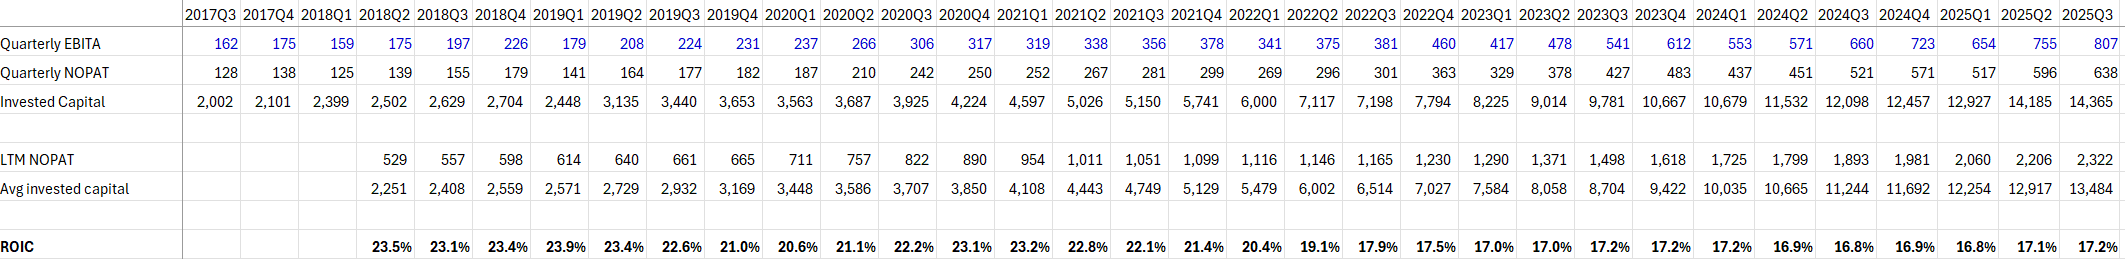
To calculate Net Operating Profit After Tax (NOPAT) for my ROIC calculation, I started with CSU’s reported consolidated EBITA and then just multiplied it by 79% to get to NOPAT, assuming a uniform 21% tax rate to negate the volatility associated with taxes. One shortcoming to this approach was this is a consolidated number and hence, overstates the NOPAT since I did not subtract non-controlling interests of Topicus and Lumine. I will come back to this shortcoming later.
Now for denominator “invested capital”, I started with total assets and then subtracted cash, restricted cash, derivatives, equity securities available for sale, and non-interest bearing current liabilities (to be specific: accounts payable and accrued liabilities, deferred revenue, income taxes payable, and provisions). With this approach, CSU’s invested capital came out to be ~$8 Billion. However, a couple of my readers mentioned that I should also add back accumulated amortization to calculate CSU’s invested capital. CSU’s current accumulated amortization is ~$6.5 Billion. So, if you add accumulated amortization, CSU’s invested capital becomes ~$14.5 Billion and ROIC comes down to ~17%. While ROIC in this approach is substantially lower than what I indicated yesterday, one of the points that I made yesterday remains valid: despite almost doubling their invested capital since 1Q’23, CSU’s ROIC has largely remained the same (but it’s high teens and not ~30%).
Some CSU bulls may think adding back accumulated amortization is too punitive, so let me explain why I think adding back accumulated amortization is closer to economic reality than punitive.
When calculating Invested Capital, the objective is to measure the total cumulative amount of cash that has been invested in the business to generate its operating profits. For serial acquirers, accounting conventions related to acquisitions significantly distort the book value of their invested capital. The primary reason we add back accumulated amortization is to restore the Invested Capital base to reflect the actual cash outlay used for acquisitions and to ensure a meaningful measure of return on that capital.
When a company acquires another business, the purchase price typically exceeds the book value of the target’s net assets. The excess purchase price is allocated to identifiable intangible assets, such as customer relationships, patents, trademarks, and proprietary technology. The identifiable intangible assets recognized must then be amortized which is systematically expensed over their estimated useful lives.
If Invested Capital is calculated using the reported balance sheet figures (which are net of accumulated amortization), the investment base will appear to shrink over time. This shrinkage is merely an accounting artifact. The fundamental goal of analyzing a serial acquirer is to determine if management is allocating capital effectively. To do this, management must be held accountable for the full price paid for their acquisitions. An example would make this abundantly clear.
If a company spends $100 million to acquire intangible assets, that $100 million is the capital deployed. If, over five years, $50 million of this value is amortized, the balance sheet will show a net asset value of $50 million. However, the company still needs to generate a return on the original $100 million it invested. By adding back the accumulated amortization, we restore the Invested Capital base to its original cost, ensuring the calculation reflects the total cash invested.
Imagine in the example above: The $100 million acquisition generates $15 million in NOPAT annually. So, in year 1, you generate ~15% ROIC. If NOPAT doesn’t grow at all in the next 5 years but invested capital shrinks to $50 Million due to amortization, it would appear the business is now generating ~30% ROIC in year 5. The unadjusted calculation misleadingly suggests ROIC has doubled. It is the adjusted calculation that shows the true economic return on the cash spent.
Now, please notice that both my numerator and denominator in ROIC calculation takes CSU’s consolidated numbers, but as mentioned earlier, CSU does have non-controlling interest in Topicus and Lumine. So, you can fine tune this approach further by deducting the impact of Topicus and Lumine. I did some back of the envelope math for the current quarter, and it’s close enough to the consolidated number that I decided not to go through the brain damage on calculating “core” CSU’s LTM ROIC in each of the last ~60-70 quarters. Ultimately, what I wanted to see is a time series data on how ROIC is evolving and with the consolidated number, while not perfect, you can get much closer to the truth.
Okay, so what does this amended ROIC inform me in terms of how I approach CSU’s valuation? To simplify, CSU currently owns hundreds of businesses whose recurring revenue grows at ~MSD rate and deploys almost all of the cash flow coming from these businesses at mid-to-high teen ROIC. Given the company currently trades at ~4.5% LTM FCF yield, I still do find the valuation to be attractive, but this amended approach helps me better in thinking through how I deploy incremental capital for my own portfolio. Frankly speaking, I would be prone to be more aggressive in increasing CSU from a relatively small position to a much larger over time when I thought the company is generating ~30% ROIC on their invested capital. Based on my current understanding, I will be much more gradual in doing so than I would be otherwise, especially considering the AI disruption risk which will take time to understand what impact (positive or negative) it will have on CSU’s fundamentals.
I appreciate the feedback and thank you for helping me think this through. While not fun to make mistakes in public, it is a cost I am very much willing to pay to improve my thinking and process.
Speaking of my portfolio, I did make some changes yesterday which I will discuss behind the paywall.
In addition to “Daily Dose” (yes, DAILY) like this, MBI Deep Dives publishes one Deep Dive on a publicly listed company every month. You can find all the 64 Deep Dives here.
Current Portfolio:
Please note that these are NOT my recommendation to buy/sell these securities, but just disclosure from my end so that you can assess potential biases that I may have because of my own personal portfolio holdings. Always consider my write-up my personal investing journal and never forget my objectives, risk tolerance, and constraints may have no resemblance to yours.