The resilience of consumer spending in the US
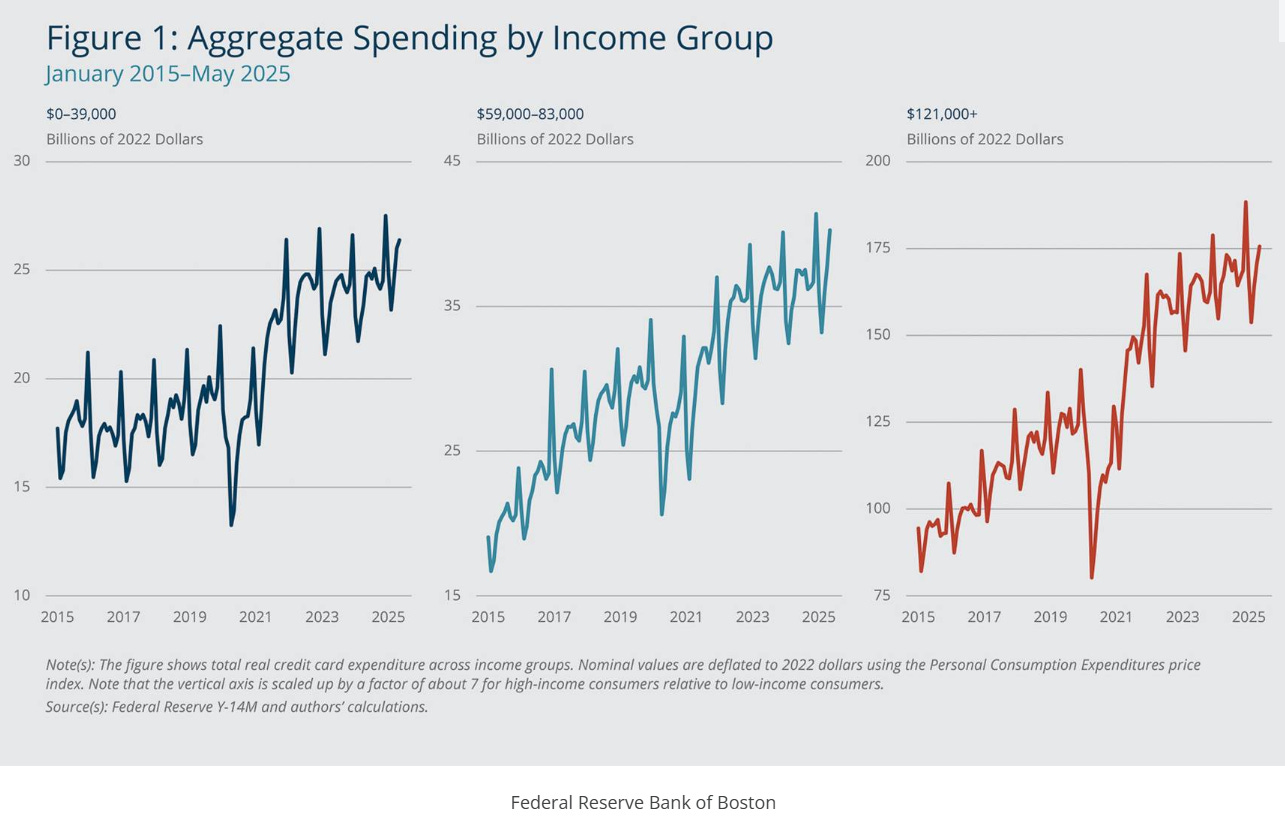
Federal Reserve Bank of Boston had an interesting piece last month about the resilience of consumer spending which is ~70% of GDP in the US. They looked at credit card spending data for low, middle, and high-income group (representing first, third, and fifth quintiles in their dataset respectively) in the last 10 years. Please note the below graph has different axes for different income groups.
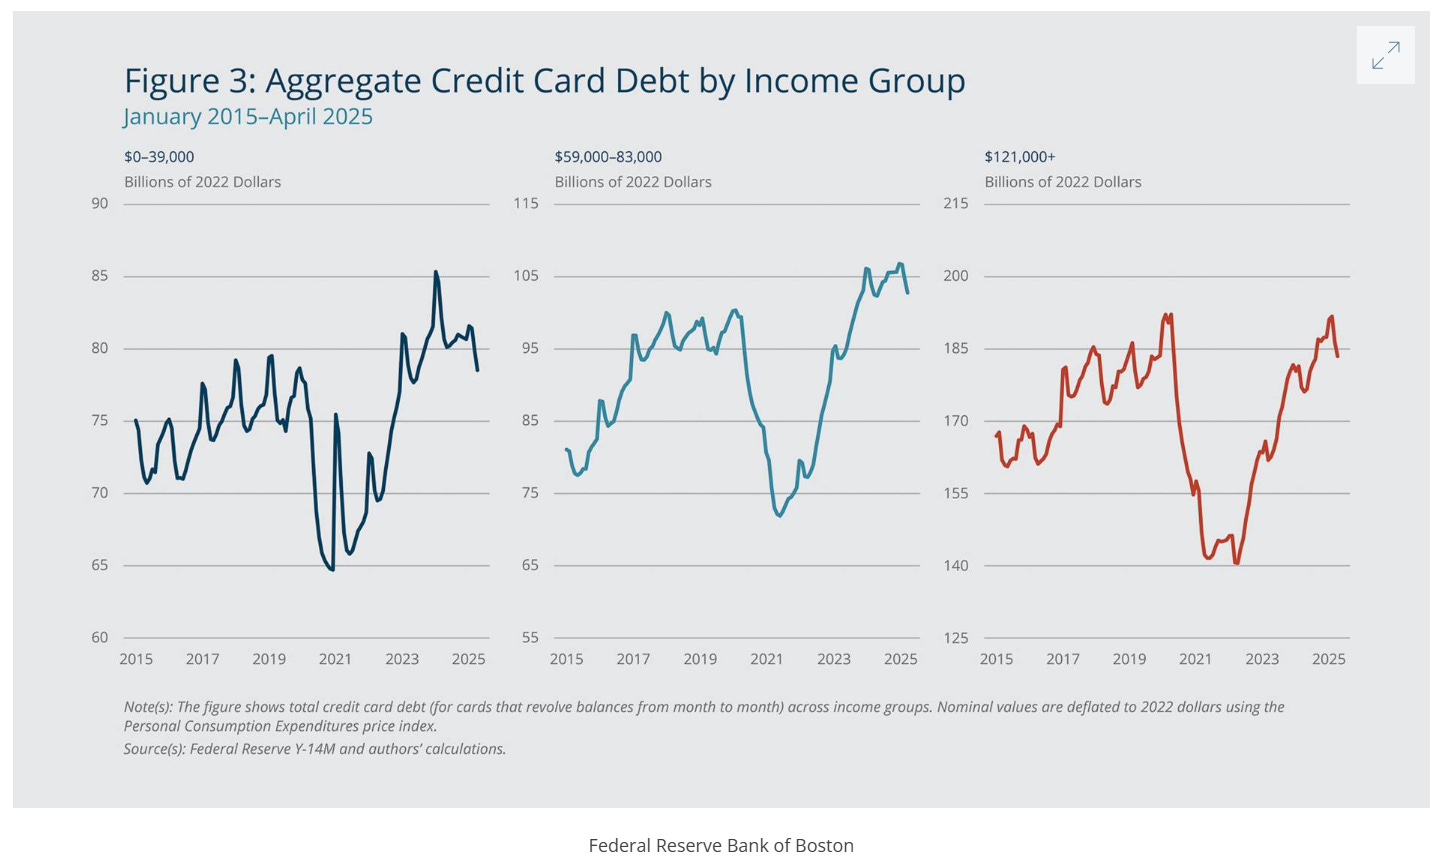
The most interesting graph (shown below) from the piece was related to aggregate credit card debt by income group in the last 10 years. From the piece:
The left panel shows that real credit card debt for low-income consumers trended up from 2015 to 2019. Debt levels fell about 15 percent from approximately $80 billion in 2019 to $65 billion in 2021, but these declines have reversed, and the current (as of April 2025) level is close to the level implied by the pre-pandemic trend—the level that would have prevailed if credit card debt had continued to grow at the pre-pandemic pace.
The middle panel shows that middle-income consumers’ real credit card debt declined from about $100 billion in 2019 to roughly $75 billion in 2021. While this 20 percent drop is larger than the 15 percent drop for low-income consumers, real credit card debt for this group has grown rapidly from the pandemic-era lows and is now above the 2019 level.
The right panel shows that high-income consumers’ real credit card debt levels fell from about $190 billion in 2019 to $140 billion in 2021. This decline of more than 25 percent is the largest of the three income groups. Notably, credit card debt for this income group remains below the 2019 high and is well below the level implied by the pre-pandemic trend.
This graph basically helped me understand how the broader economy is chugging along just fine even though “vibecession” has increasingly become part of the conversation. The vibes are not great because a lot of people are indeed feeling the pinch whereas the high income group remains remarkably resilient. It is because of this high income group macro data may continue to be strong for a while:
the fact that credit card debt levels for the highest-income consumers are currently well below the pre-pandemic trend implies that these consumers have room to spend out of unused credit even if their cash on hand has been depleted.
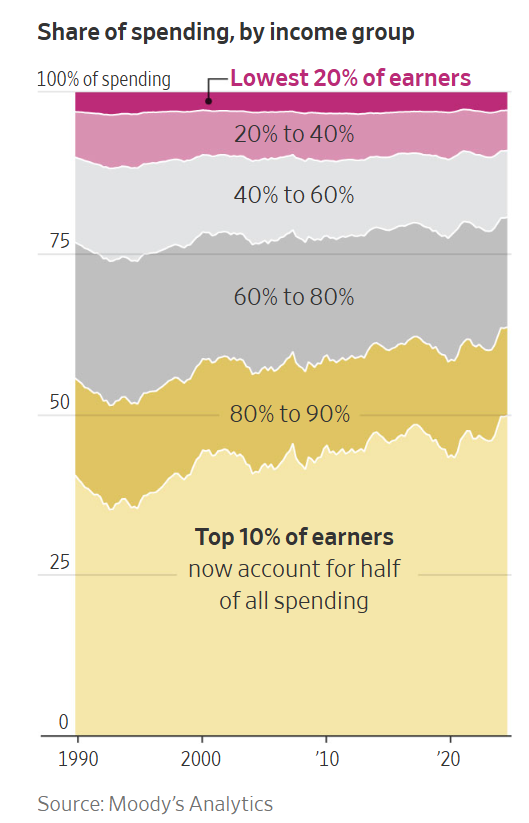
US economy has increasingly been driven by the high income group for a while as half of the consumer spending (vs ~36% three decades ago) basically comes from just top decile of earners. WSJ highlighted early this year this growing disparity of how the economy has fared for high and low-income people:
Between September 2023 and September 2024, the high earners increased their spending by 12%. Spending by working-class and middle-class households, meanwhile, dropped over the same period.
Taken together, well-off people have increased their spending far beyond inflation, while everyone else hasn’t. The bottom 80% of earners spent 25% more than they did four years earlier, barely outpacing price increases of 21% over that period. The top 10% spent 58% more.
All these data points basically tell me the economy may prove to be quite resilient on an aggregate basis in the near term even if the consumer sentiment continues to exacerbate for valid reasons. However, it also does indicate the economy can be much more vulnerable to any shock to high-income group.
In addition to "Daily Dose" (yes, DAILY) like this, MBI Deep Dives publishes one Deep Dive on a publicly listed company every month. You can find all the 62 Deep Dives here.
Current Portfolio:
Please note that these are NOT my recommendation to buy/sell these securities, but just disclosure from my end so that you can assess potential biases that I may have because of my own personal portfolio holdings. Always consider my write-up my personal investing journal and never forget my objectives, risk tolerance, and constraints may have no resemblance to yours.
My current portfolio is disclosed below: