The Great Concentration of Productivity
A couple of weeks ago, I wrote about the great decoupling of labor and capital in which I pointed out that today’s megacap tech companies achieved staggering revenue growth with progressively fewer incremental employees, a phenomenon well underway even before the advent of Gen AI. However, that was bit of a micro view; a recent piece published on the Chicago Fed Letter provided a more profound, macro context.
It turns out this decoupling of revenue from labor is a symptom of a much larger, economy-wide phenomenon: the Great Concentration of productivity.
The Chicago Fed paper analyzed US Total Factor Productivity (TFP), and found that it has been “highly concentrated” for the past four decades. The data is astonishing.
Since the late 1980s, the Information Technology (IT) sector has been responsible for ~45% of all TFP growth in the U.S. economy. It has done this while accounting for only 8% of the private business sector’s total value added. Over the 1988-2023 period, annual TFP growth in the IT sector averaged 2.9%. In all non-IT sectors combined, it averaged a mere 0.31%
From the paper:
“As the figure shows, aggregate TFP has increased by a factor of 1.4, or 40%, in the 36 years since the start of 1988, while the IT sector’s TFP has increased by a factor of about 2.78, or 178%. In contrast, TFP in all the non-IT sectors combined has increased by a factor of only about 1.12, or 12%. In panel B of figure 3, we similarly plot the cumulative contributions of TFP growth in the IT and non-IT sectors to aggregate TFP growth. The IT sector has contributed approximately 17 percentage points to cumulative TFP growth since 1988, and the non-IT sectors about 20 percentage points. Thus, in cumulative terms, the IT sector again accounts for roughly 45% of aggregate productivity growth”

Of course, you may be wondering if the IT sector is so hyper-productive, why hasn’t it taken over much more of the entire economy? Why is it still just 8% of value added?
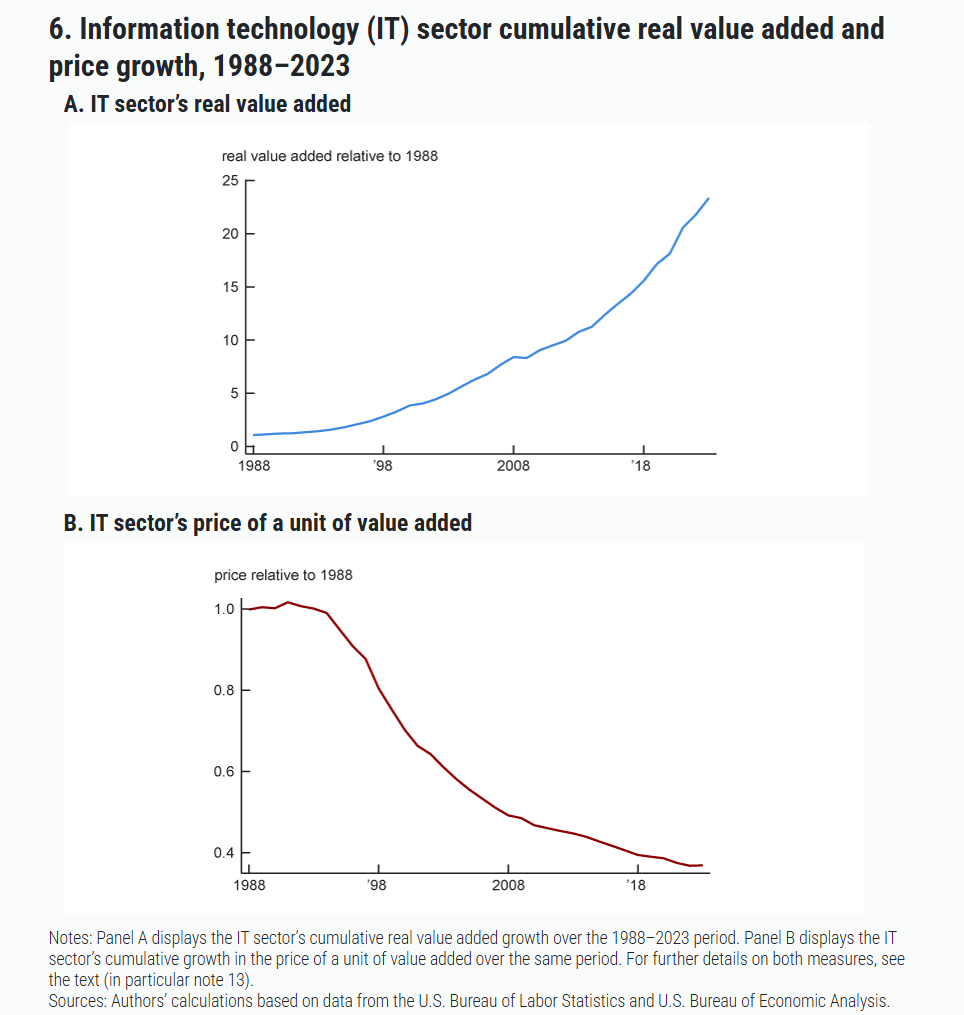
Because prices have collapsed. While the real value added has exploded by over 2,300% since 1988, the price of that output has declined by 70%. Again, from the paper:
“Figure 6 shows why this approximate constancy over the longer run holds. In panel A, we plot the cumulative growth in real value added for the IT sector: In real terms, value added of the IT sector increased by over 2,300% between 1988 and 2023. In panel B, we plot the cumulative growth rate of the price of a unit of value added of the IT sector: This price declined by almost 70% over the 1988–2023 period. Putting these results together, along with the fact that aggregate nominal value added of the entire private business sector grew about 500% over the same period, leaves the share of the IT sector only slightly higher in 2023 than in the late 1980s.”
The above graph is perhaps good indication of massive consumer surplus we get to enjoy because of the tech companies! The scalability of software and networks is the same force that drops prices so dramatically, delivering immense value to consumers and keeping the sector’s share of the economy in check. The precipitous drop in price IS the diffusion fuel as it turns hospitals, farms, and factories into downstream beneficiaries of IT’s TFP without making them IT companies which likely helps maintain this paradox: IT drives growth everywhere while its measured share of the economy hardly rises.
Nonetheless, this extreme concentration of productivity does have potentially uncomfortable implications, especially now that AI is into the scene. The reliance of US economy on a single engine of productivity can make aggregate growth “more fragile”. From the paper:
“if similar trends continue, e.g., because of the introduction and rollout of AI (artificial intelligence) technologies, the medium-term outlook for U.S. economic growth may well hinge on developments in the IT sector. And third, given the concentration of growth in a single sector, maintaining a steady pace of aggregate economic growth may be more fragile than at times when the sources of growth were more widespread. Will the rapid TFP growth in the IT sector stall out, or will it accelerate based on new innovations in AI and other cutting-edge computing technologies? Given the key role of IT in driving aggregate TFP growth over the past few decades, the answer may have profound implications for future advances in economic conditions.”
After looking at how almost half of the last few decades of productivity growth came from just one sector, it may help contextualize the level of concentration we are seeing in equity markets these days. While everyone in the economy eventually becomes the beneficiary of such diffusion of technology largely via consumer surplus, the shareholder value may accrue to increasingly fewer and fewer companies.
In addition to “Daily Dose” (yes, DAILY) like this, MBI Deep Dives publishes one Deep Dive on a publicly listed company every month. You can find all the 64 Deep Dives here.
Current Portfolio:
Please note that these are NOT my recommendation to buy/sell these securities, but just disclosure from my end so that you can assess potential biases that I may have because of my own personal portfolio holdings. Always consider my write-up my personal investing journal and never forget my objectives, risk tolerance, and constraints may have no resemblance to yours.
My current portfolio is disclosed below: