Some charts that caught my attention
a16z recently published their “State of Markets” presentation. I will share some of the charts from the presentation that caught my attention.
First of all, I do want to highlight a key limitation of a16z’s data; they mention that the presentation only includes data voluntarily provided to a16z by certain companies, including both portfolio companies and companies in which a16z has not invested. If things are not going well in your private companies, I can imagine simply not responding to a16z’s request for data, especially if they hadn’t invested in your company. So, there may be a systemic upward bias in some of these numbers. Nevertheless, given the size of their AUM (~$90 Billion), they tend to have a good grasp of where things are in the private market.
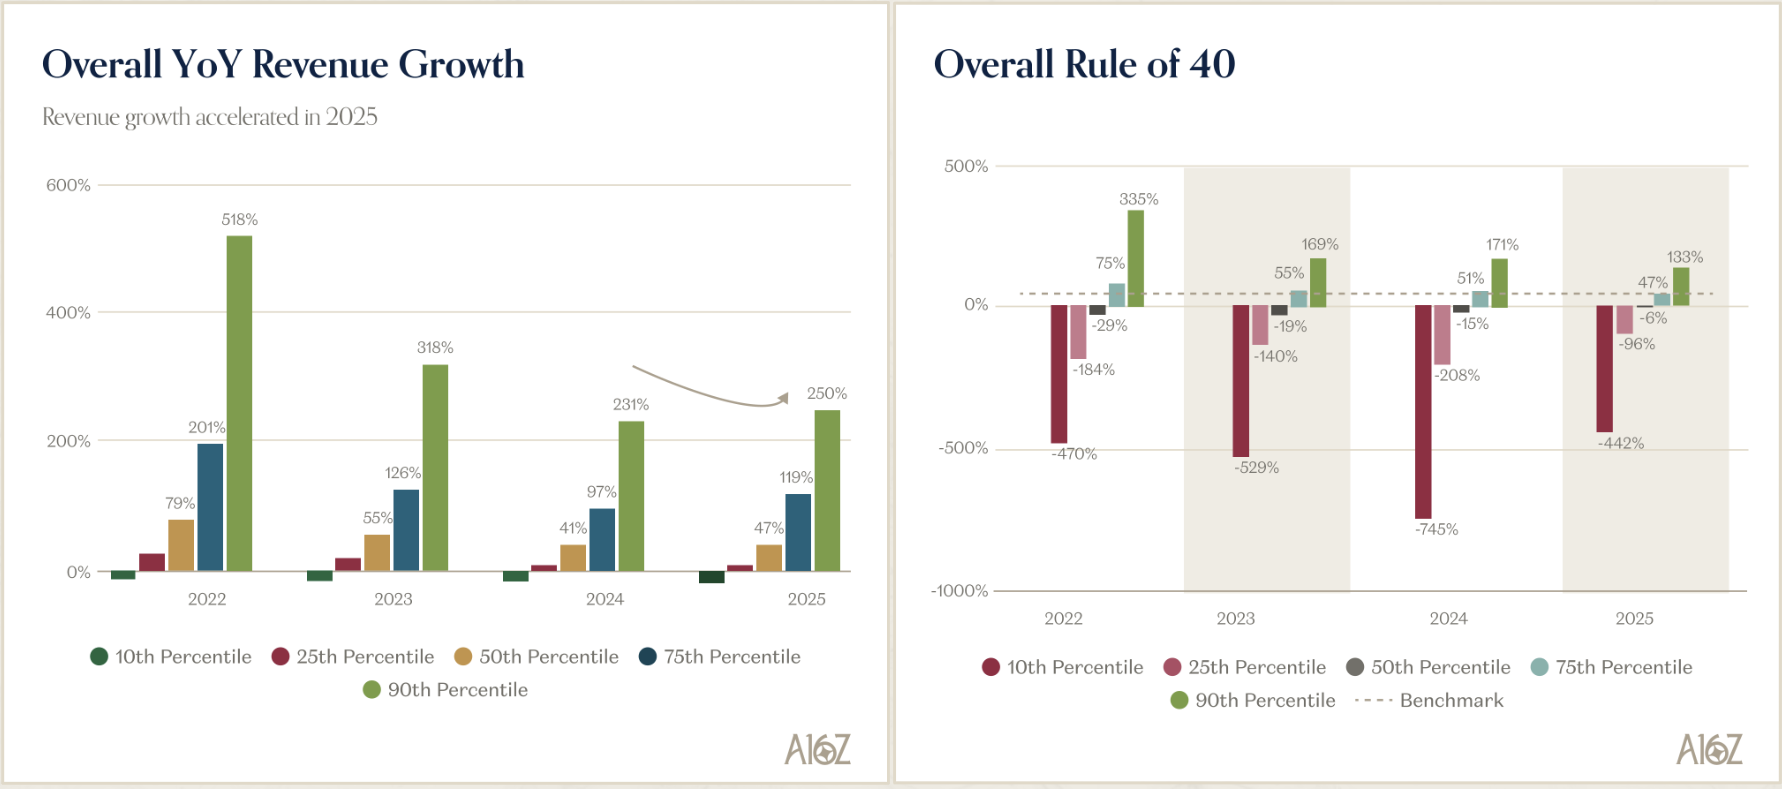
The first chart that stood out to me was how revenue growth in private companies accelerated in 2025. However, for the top-tier companies (i.e. 75th and 90th percentile companies), margins appeared to have worsened significantly in 2025. While revenue growth accelerated from 97% to 119% for the 75th percentile and 231% to 250% for the 90th, their “Rule of 40” scores actually declined (dropping from 51% to 47% and 171% to 133%, respectively).
Since the Rule of 40 is the sum of growth and margin, a falling score amidst rising growth suggests that margins are plummeting; specifically, the implied margins for the 90th percentile drop from -60% in 2024 to -117% in 2025, indicating these companies are burning more cash to fuel that extra growth. Given this dynamic, the economics of incremental growth remains an open question.
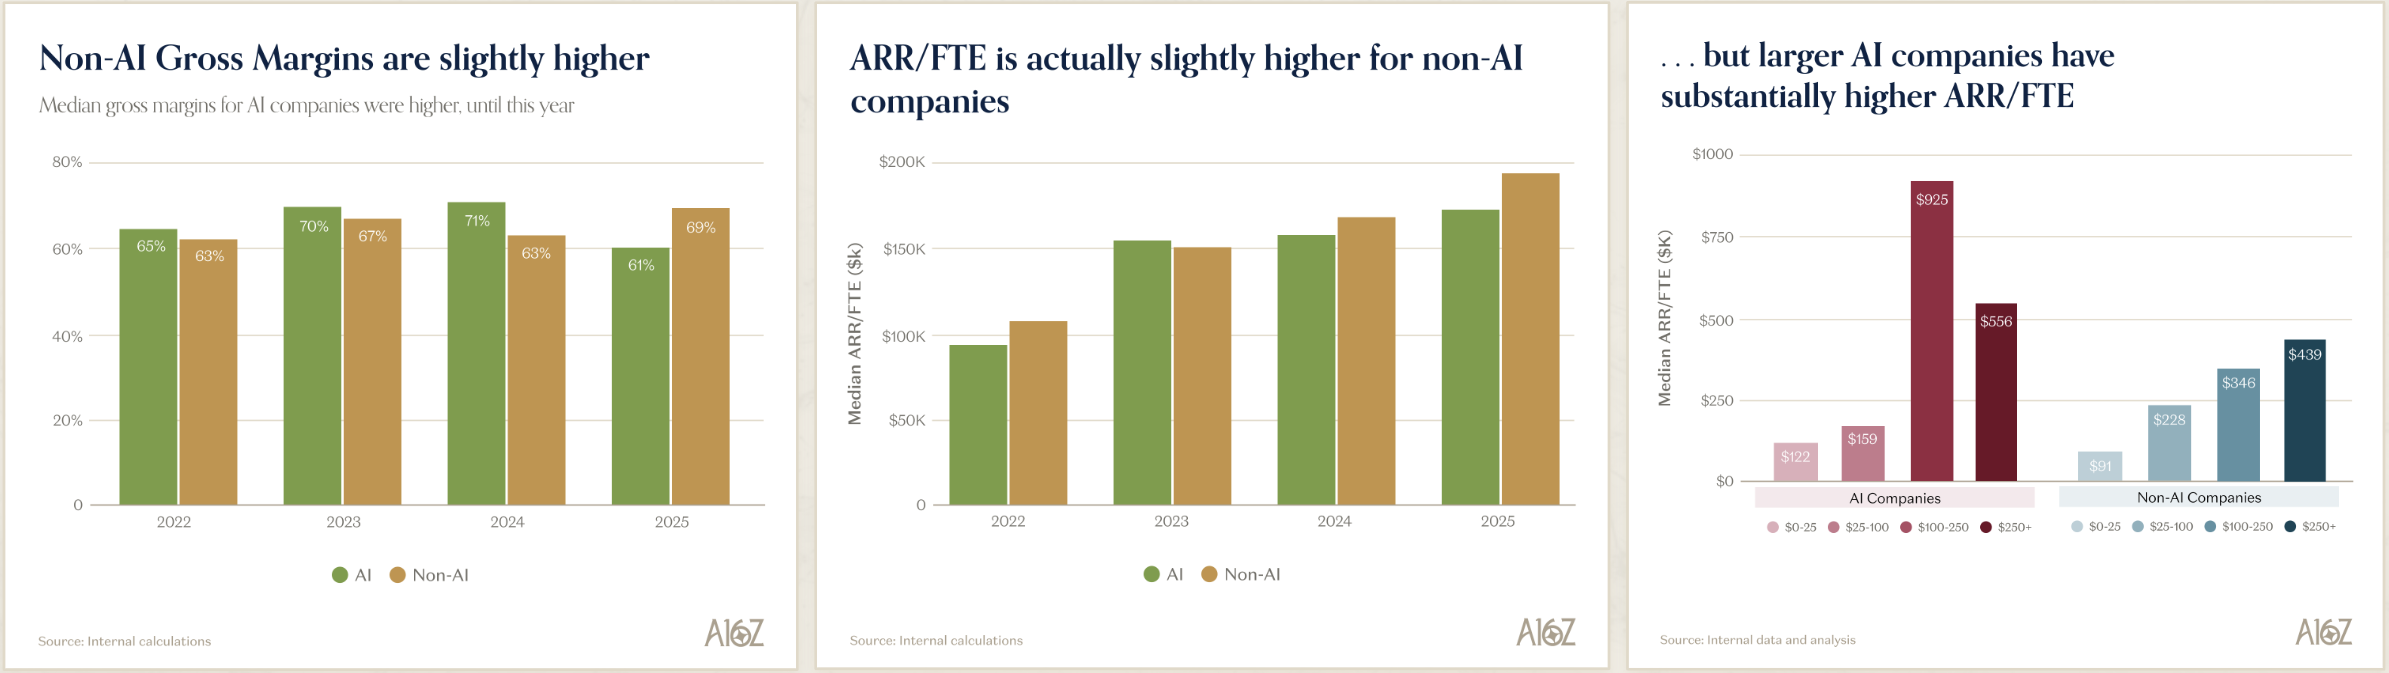
One counterintuitive finding, especially given the narrative that AI companies should be hyper-efficient "software that writes software", was that the median non-AI company actually had higher ARR per FTE (full-time employee) compared to an AI company. However, as the AI companies become larger, they do become substantially higher ARR/FTE vs non-AI companies. It is also good to see that non-AI and AI companies have similar gross margin although I do wonder if I’m looking at apple-to-apple comparison of gross margins given AI companies are quite notorious in defining “gross margin” in a very generous way.
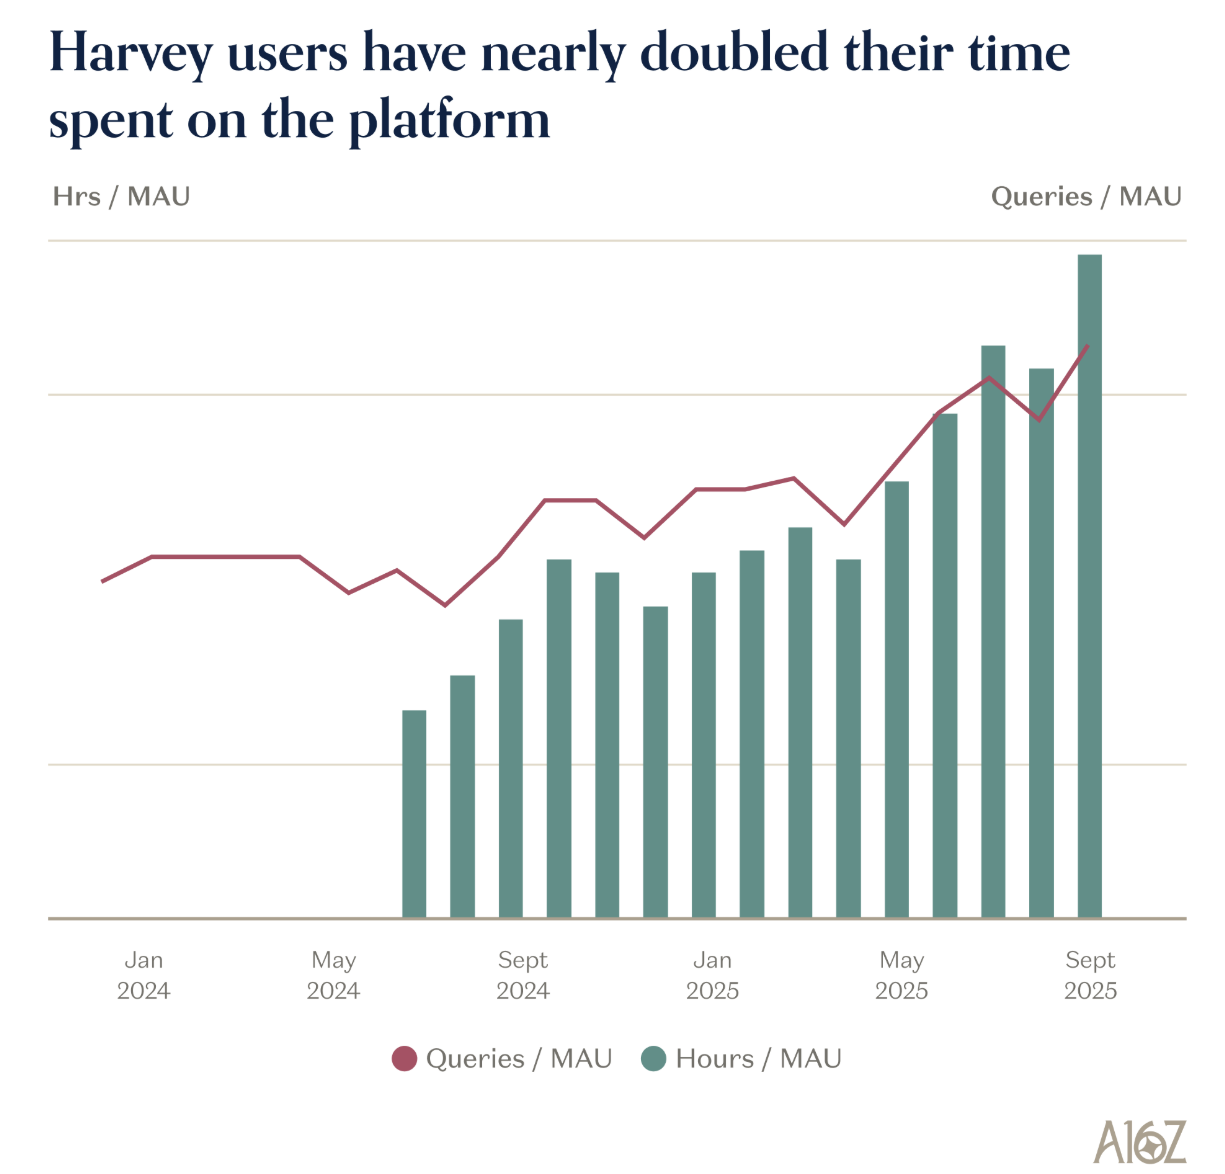
It also stood out to me that there is indeed a very strong product market fit in some domains. We all know about coding, but Harvey’s (the dominant AI for law firms) numbers also seem quite encouraging. Both queries per MAU and hours spent per MAU continue to go up.
a16z also had some discussions on public markets, and I did find it odd that they showed things such as “Price to Book” or “Debt to equity” charts while discussing publicly listed AI companies. a16z may need a couple of folks who have a better grasp on how public market investors look at balance sheets!
A couple of charts that I thought were discouraging for AI bulls are retention rates for both Claude 4 and Gemini 2.5 Pro. Let me just say that if this were the retention rate for MBI Deep Dives, I would be currently looking for a job! The most worrying thing is the retention rate is deteriorating for the newer cohorts. You would imagine as the models get more and more capable, the newer cohorts would have higher retention, and yet we are seeing the exact opposite. a16z captioned this chart as “early users stick with models a bit longer, but later users quickly switch to the new hot thing”. If that’s true, it may mean the model’s ability to generate incremental revenue is directly tied to staying at the cutting edge and in that case, it is perhaps an indication that training costs may need to be included in “cost of revenue” and not shoved down to “R&D”. How we treat training cost may become a key tug of war between AI bulls and bears if the model race doesn’t show any sign of slowdown.
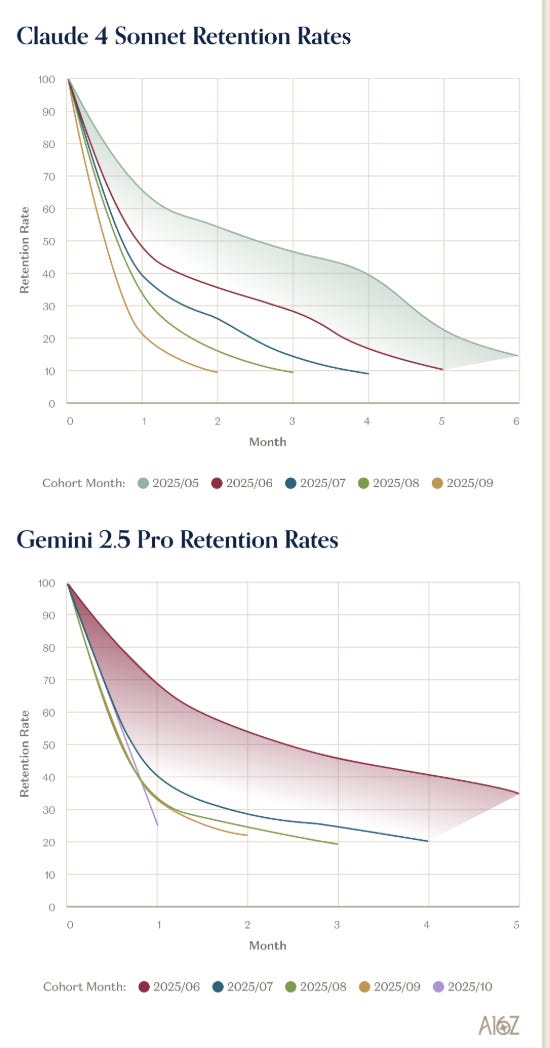
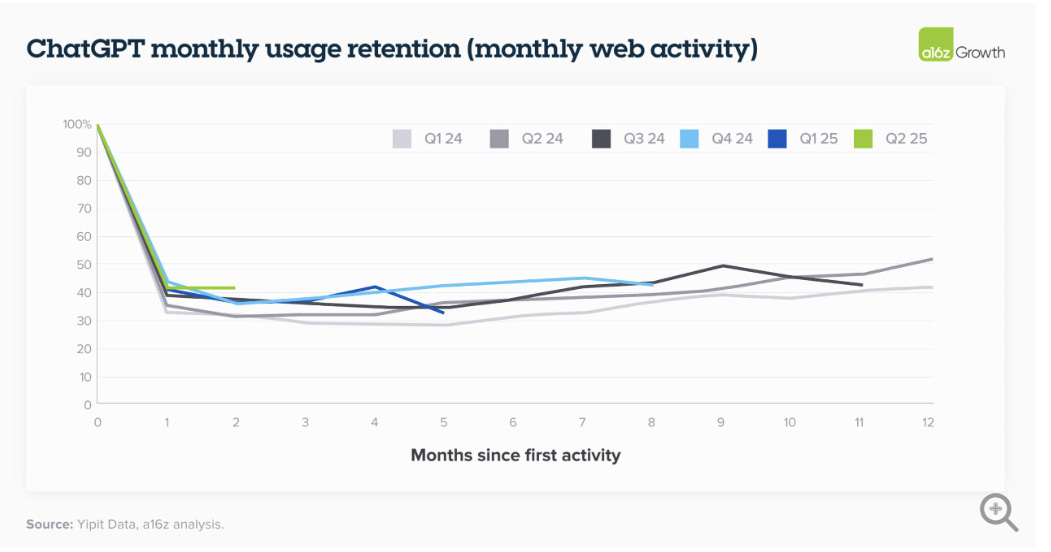
I was curious to see how the retention rate looks like for ChatGPT. An older a16z blog post seems to indicate it settles around ~40% and even have a tendency to exhibit “smile curve”. Again, the “smile curve” may be an indication that cost for training should be considered as directly responsible for inducing churned users to come back.
The other quite discouraging chart was the massive scale of subsidies AI companies still seem to be offering their customers as free tokens continue to dwarf paid tokens. While total tokens consumed continue to go up unabated, the paid tokens processed still don’t seem to have any clear direction. As I have mentioned before, while I do not doubt for a moment that these AI models can be incredibly valuable for their users, we may be underestimating the challenges in capturing such value by the model developers given the model race remains fairly competitive. Ultimately, value capture is often a function of industry structure rather than your ability to generate value for your customers.
In addition to “Daily Dose” (yes, DAILY) like this, MBI Deep Dives publishes one Deep Dive on a publicly listed company every month. You can find all the 65 Deep Dives here
Current Portfolio:
Please note that these are NOT my recommendation to buy/sell these securities, but just disclosure from my end so that you can assess potential biases that I may have because of my own personal portfolio holdings. Always consider my write-up my personal investing journal and never forget my objectives, risk tolerance, and constraints may have no resemblance to yours.
My current portfolio is disclosed below: