Room at the Top
I came across this astonishing chart from Michael Batnick yesterday showing that the combined market cap of the bottom 434 companies in the S&P 500 equals that of the top 5. It is the time series, though, that drives home just how unusually concentrated the index has become over the last 30 years. Even at the height of the tech bubble, the number was below 350 and following the crash, the number went closer to 200. And we have been at or above tech-bubble levels of concentration consistently since 2019, save for a brief pause in 2022. While it can be tempting to jump to the “B” word, what should temper such inference is that it’s not just market cap, but also earnings that largely mirror this massive concentration at the top.
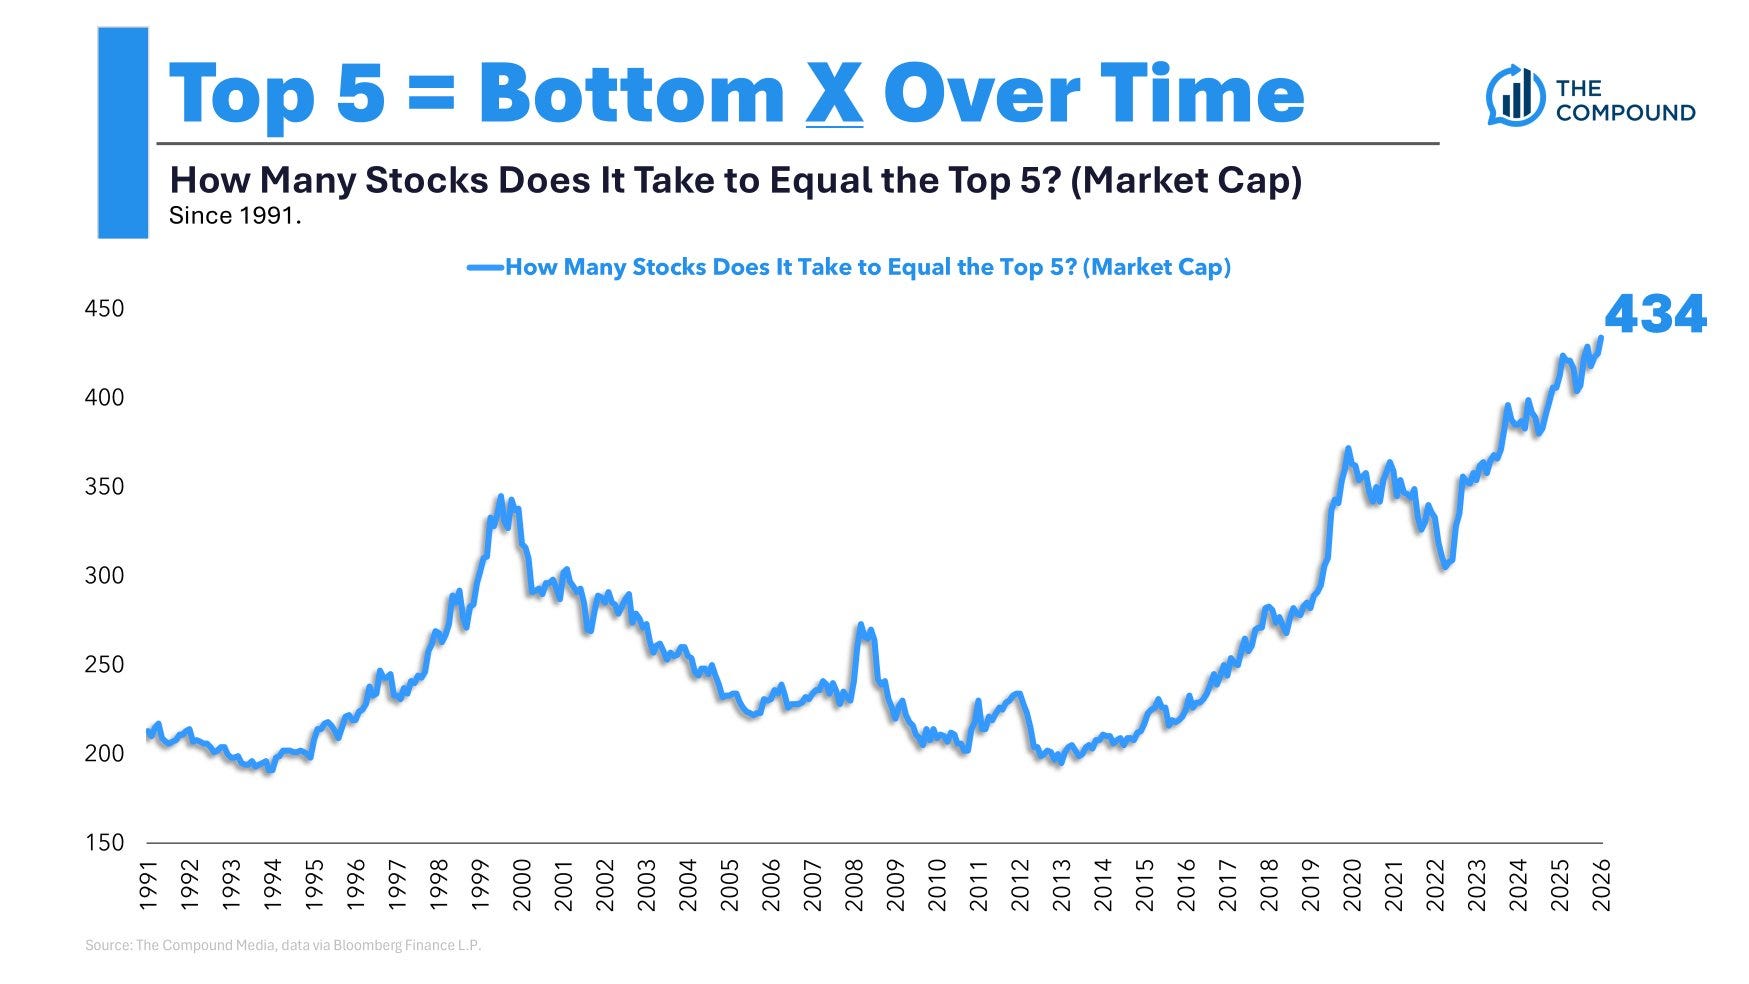
In a follow-up tweet, he noted: “Interestingly, the TTM net income of the top 5 stocks is also equal to the bottom 436 companies.” For what it’s worth, when I asked Claude to fact-check this, it came up with 420. Whatever the actual number is, my point is the deeper truth doesn’t change: technology distribution is now truly global, a handful of companies have aggregated demand on top of it, and with near-zero marginal cost, much of every incremental dollar of revenue falls straight to the bottom line. Concentrated market cap hence looks more like the market faithfully mirroring where the profits have actually gone.
But wait a minute, aren’t we leaving behind the world of zero marginal cost? Perhaps, but given the allegedly lofty inference margin in the API layer for the labs, one wonders whether we haven’t quite diverged from the zero marginal world as much we thought we did. More importantly, I sometimes wonder what it would imply if all this capex buildout actually yields attractive returns. I asked Claude how many of the bottom S&P 500 companies it would take to match the capex of the top 5. Claude said 340 companies. There are couple of things I would highlight here. First, the top 5 includes Nvidia and Apple, neither of which is meaningfully participating in the buildout (though Nvidia is its largest direct beneficiary). If you swap them out for the five hyperscalers (Amazon, Alphabet, Microsoft, Meta and Oracle), their ~$586 Billion of LTM capex matches that of the bottom ~420 companies combined. So it’s no longer just market cap and earnings; capex, too, is now concentrated to a similar degree. And second, this is an LTM number. I imagine the NTM capex for hyperscalers will be even more extreme. Since today’s capex is tomorrow’s earnings base, if the buildout continues and returns meet or exceed expectations, you can imagine how this concentration may start to feel politically a bit… too uncomfortable!
One challenge with discussions of concentration (or income and wealth inequality) is that, I suspect, most people imagine stagnation at the top as things become more and more concentrated. It’s counterintuitive, but things can keep getting more concentrated even while there is a surprising amount of churn within the concentrated group. So far, capitalism hasn’t let anyone rest on their laurels, even at the top. Consider this slide from Coatue’s recent “Public Markets Update” deck: nearly half of the S&P 500’s top 15 companies in 2026 weren’t on the list in 2022!
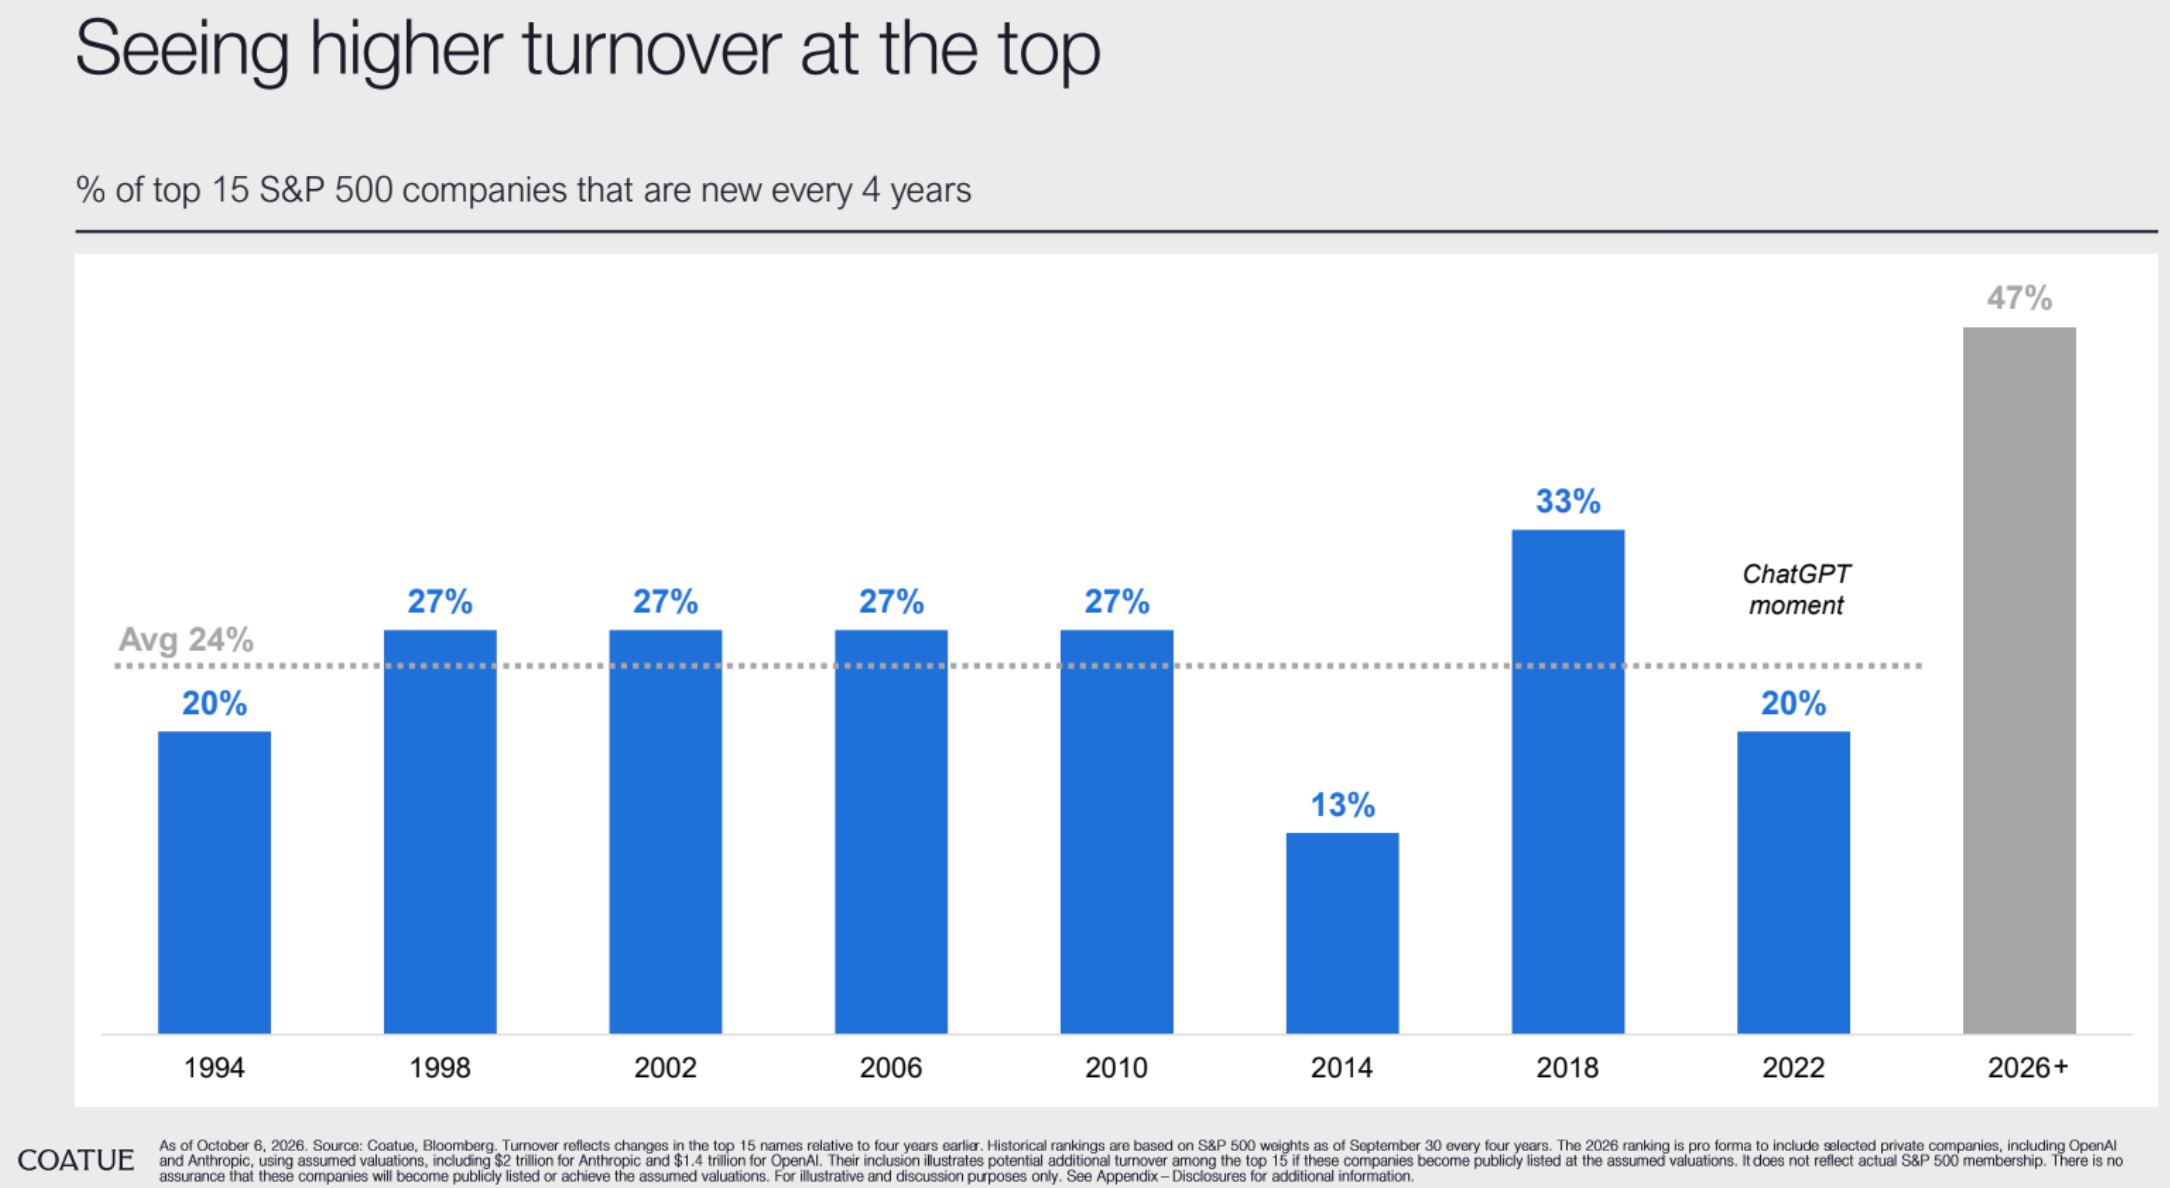
Comparing the top 15 before and after the ChatGPT moment, the list is now, understandably, dominated by tech and semiconductor companies. As we enter the age of intelligence, companies across its value chain are benefiting the most, and those that dropped out are mostly the ones without an active role in it.
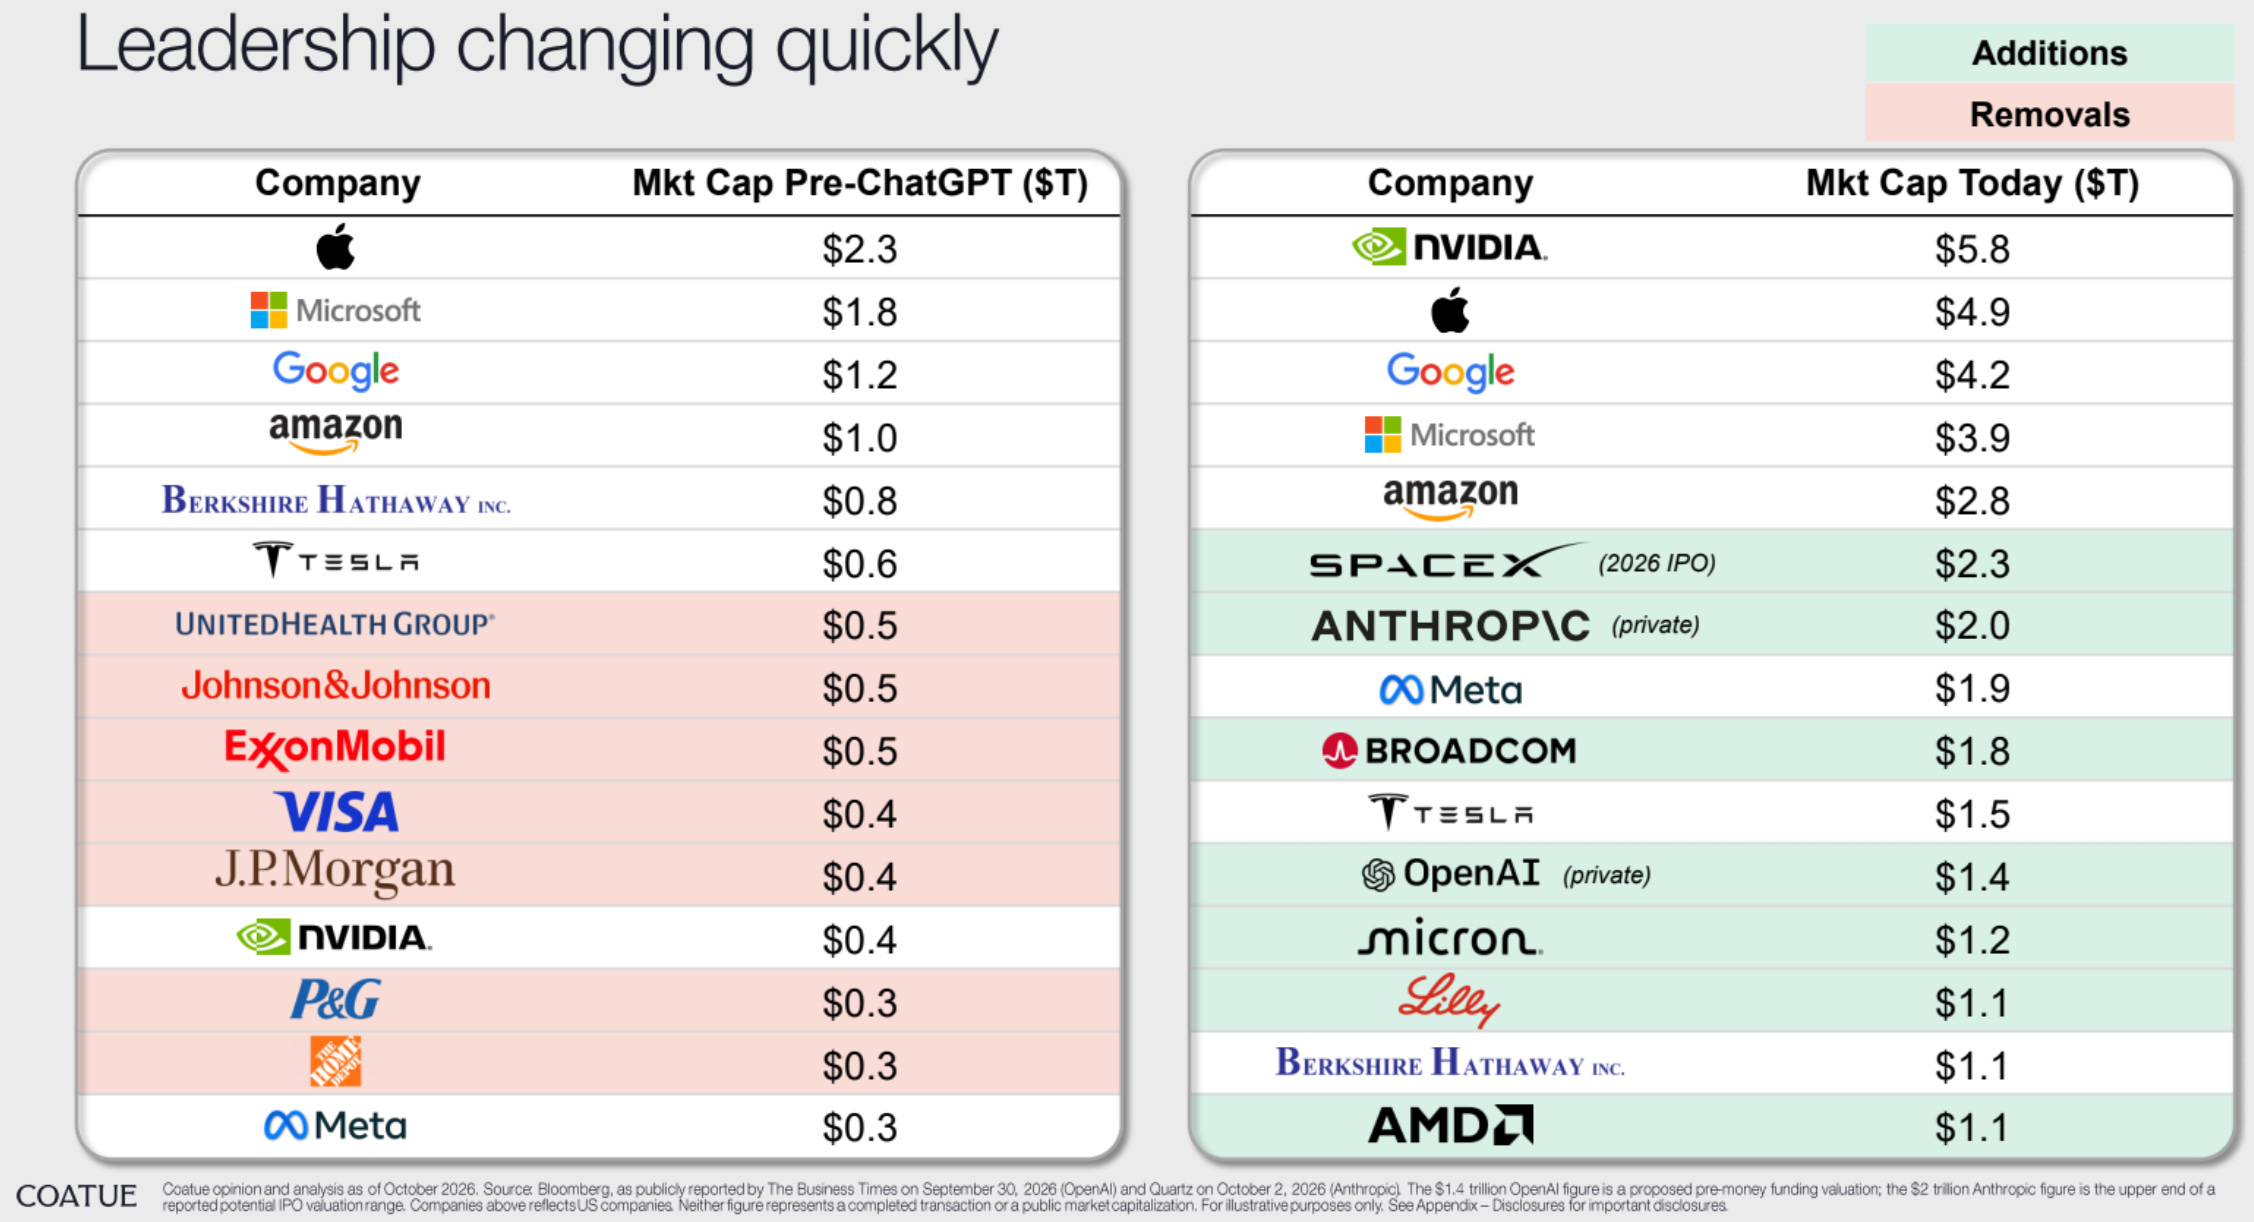
The question is: what will this list look like in 2030? Now that the list is dominated by companies across the intelligence value chain, should we expect some sort of stagnation? That is definitely a plausible scenario. Politically, concentration is always a cause for concern and as we head into the 2028 election in a couple of years, such concentration can become a thorny topic. Personally, I think we will muddle through the potential political backlash if and only if things remain quite dynamic at the top. I believe it is likely to be far more politically palatable in the near to medium term if we observe Schumpeterian creative destruction among the top 10-15 companies in the S&P 500.
But what about the long term? Even with plenty of creative destruction near the top, concentration presumably can’t keep rising forever, though it’s hard to rule out it going even further from here. But we have actually seen even deeper concentration in the stock market before. At the beginning of the 20th century, railroads contributed ~63% of the US and ~50% of the UK total stock market capitalization. Today, it is less than 1%. History suggests today’s technologies often become tomorrow’s commodities. AI is not railroads, and there are important differences that may make these historical parallels largely irrelevant. The speed at which AI diffuses through existing distribution, the talent density at the top, and the cash flows and fortress balance sheets built during the near-zero-marginal-cost era arguably raise the odds of concentration beyond anything we have seen before.
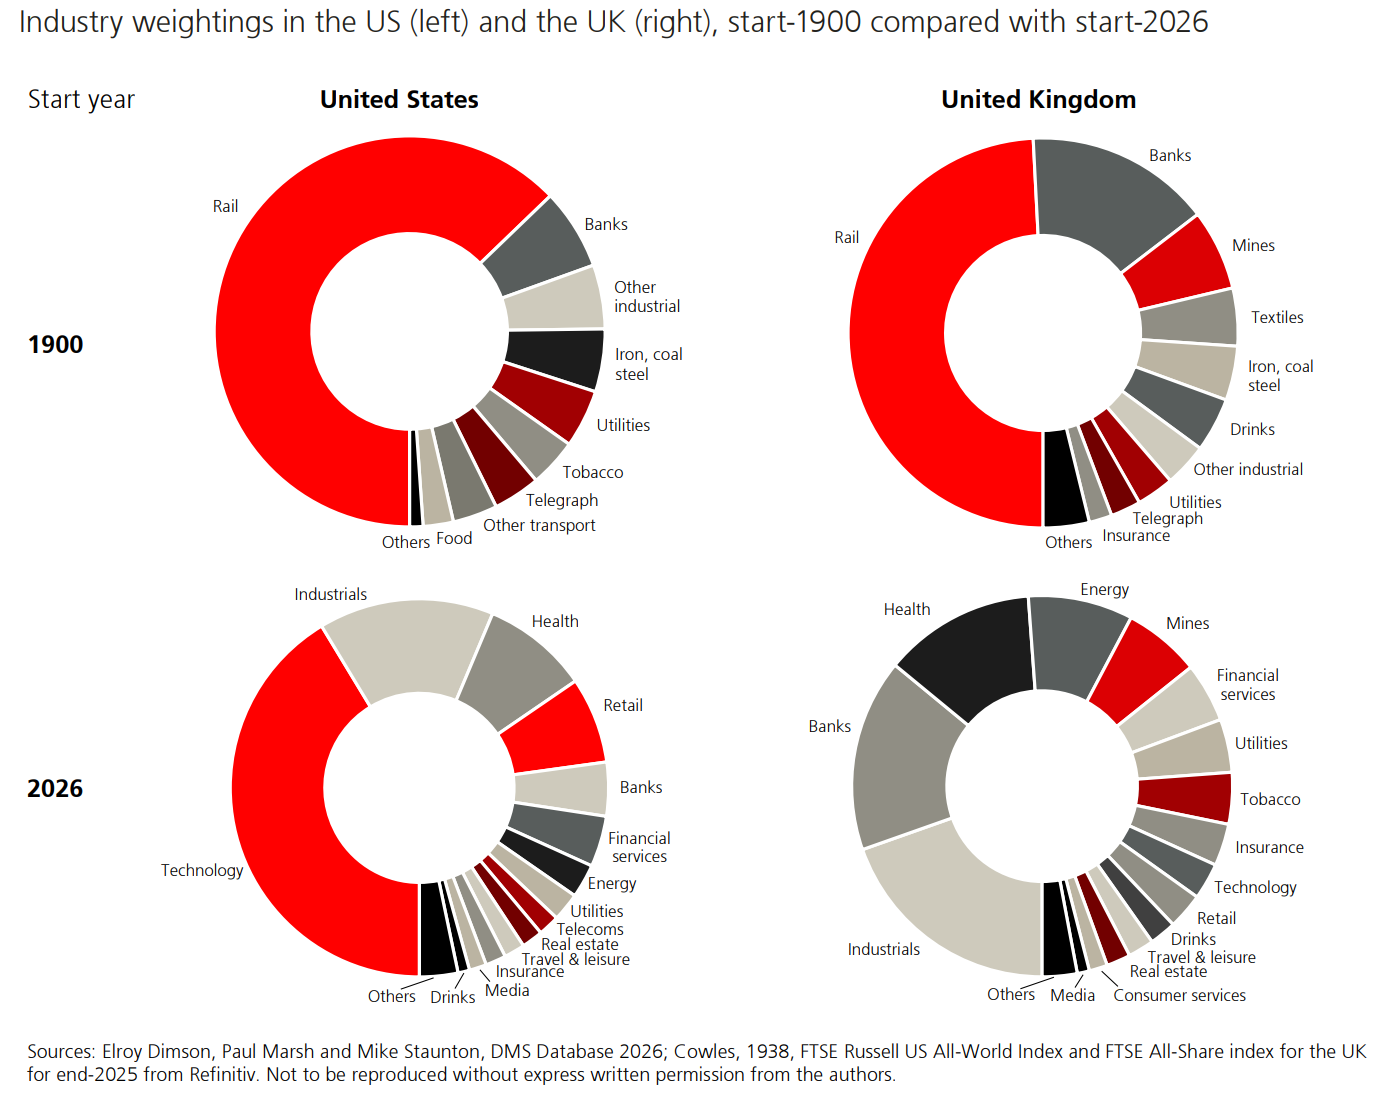
I am a naturally optimistic person. I share the unease about a world in which a handful of companies generate much of its profits, but despite the differences, railroads can still be quite instructive. The same UBS report had this rather mind boggling stat:
“…railroads, despite being a declining industry over the period of the study (falling from 63% of the US market in 1900 to less than 1% today), actually outperformed both the US stock market and their newer technology competitors since 1900.”
Ultimately, the economy the railroads helped make possible grew far larger than the rails themselves. Refrigerated railcars turned a St. Louis brewery into Budweiser. A national rail network turned a mail-order catalog into Sears. Railroad express contracts turned a parcel-and-cash courier into American Express. Grain sheds at the end of a rail line turned an Iowa grain flathouse into Cargill.
AI may inflict plenty of creative destruction, but it will likely also usher in a Cambrian explosion of small businesses that can hire and scale with AI agents faster than ever before. Much of their spending may well flow straight back to the top, so the “434” may not come down anytime soon. But perhaps the most hopeful version of this story doesn’t require the top 5 to shrink at all; it’s one where companies not yet founded grow large enough to join them.
Subscribers get the daily journal and five+ years of Deep Dives, i.e. full-length analyses with financial models on 70+ companies. The daily is just how I think out loud between the Deep Dives!
Current Portfolio:
Please note that these are NOT my recommendation to buy/sell these securities, but just disclosure from my end so that you can assess potential biases that I may have because of my own personal portfolio holdings. Always consider my write-up my personal investing journal and never forget my objectives, risk tolerance, and constraints may have no resemblance to yours.
My current portfolio is disclosed below: