What’s embedded in Meta’s stock price?
Disclosure: I am long META/FB shares
Subscribe to receive future posts in your inbox
Let me cut to the chase here. This isn’t one of my typical deep dives. While in a typical deep dive, I dive into both numbers and narrative to understand what’s embedded in stock price, I will primarily focus on the numbers in this piece. Numbers will, of course, also highlight some of the embedded narrative. I believe the major narratives related to Meta are widely discussed and understood but the numbers often get lost in translation.
Before I explain the model, please remember, the projections in the model are NOT what I forecast or think will happen. It is my attempt to figure out what’s embedded in the stock price today. However, what’s embedded in stock price does NOT follow scientific approach, and many investors will have different ways to figure out the embedded assumptions in the stock. This is simply my personal attempt. For 2022, I modeled in a way so that the topline closely resembles the consensus estimates. However, from 2023 and beyond, I consciously avoided to take into account of consensus estimates out there as I think street estimates are lot less useful two years (or more) out.
If you are reading my deep dive for the first time, I strongly encourage you to read my piece on “approach to valuation”. Please read it at least once so that you understand what I am trying to do here. I follow an “expectations investing” or reverse DCF approach as I try to figure out what I need to assume to generate a decent IRR from an investment which in this case is ~8%. Then I glance through the model and ask myself how comfortable I am with these assumptions. As always, I encourage you to download the model and build your own narrative and forecast as you see fit to come to your own conclusion. None of us have the crystal ball to forecast 5-10 years down the line, but it’s always helpful to figure out what we need to assume to generate a decent return.
The Meta Model
In 2021, Meta has segmented its business in two categories: a) Family of Apps (FOA), and b) Reality Labs (RL). FOA consists of revenue from Facebook, Instagram, Messenger, WhatsApp, and other services. RL derives revenue from AR/VR related hardware, software, and content.
Almost 99% of FOA revenue comes from advertising. Let’s simplify the ad business a little before getting into the numbers.
Advertising revenue is driven by number of ads and Cost per thousand impression(CPM). Number of ads and CPM are driven by metrics such as Daily Active Users (DAU) or Monthly Active Users (MAU), and the effectiveness of the ad. The effectiveness of the ads can be understood by better conversion, and Return on Ads dollar spent (ROAS). While Meta discloses DAU/MAU numbers consistently, other metrics are not publicly disclosed and hence the two metrics I’ll focus on is DAU/MAU and Average Revenue Per User (ARPU). Whenever I’ll mention DAU/MAU, it will indicate to Facebook’s numbers (the core blue app), and will NOT include Instagram and WhatsApp’s numbers. However, Meta also discloses Daily Active People (DAP), and Monthly Active People (MAP) publicly which include users from all its FOA related apps.
So, what do we see? Facebook had 1.9 Bn DAU and 2.9 Bn MAU in 2021, implying two-third of DAU being active on a monthly basis. While the global DAU/MAU relationship has remained stable over the last five years, there are interesting nuances by geography. What I found particularly counterintuitive is Facebook has the highest DAU/MAU ratio in US & Canada. However, unfortunately the DAU/MAU ratio has been consistently slipping over the last five years in US & Canada. DAU has been stable over the last two years in this region, and I have modeled it to steadily decline from here for the next few years and in the out years, the decline is assumed to accelerate. I have modeled similar dynamic in Europe as well even though Europe’s DAU performed better than US & Canada historically. For Asia Pacific, and Rest of the World, my model assumes low-single digit growth in DAU.
For MAU, I used the DAU/MAU ratio to project the MAU in future years. Here too I assumed a steady decline in DAU/MAU ratio in the next 10 years for all the regions. The DAU/MAU trend essentially implies Meta will be a share donor to TikTok, Snapchat, and perhaps yet-to-be invented social apps in the future. One potential risk here is when network effects unravel in the opposite direction, it can be just as dramatic and it may not be as linear deceleration as modeled here.
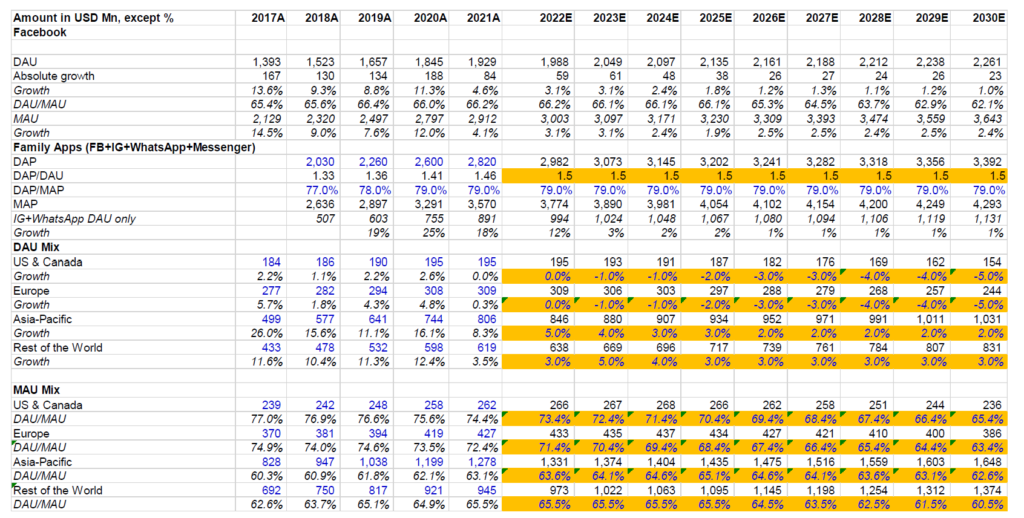
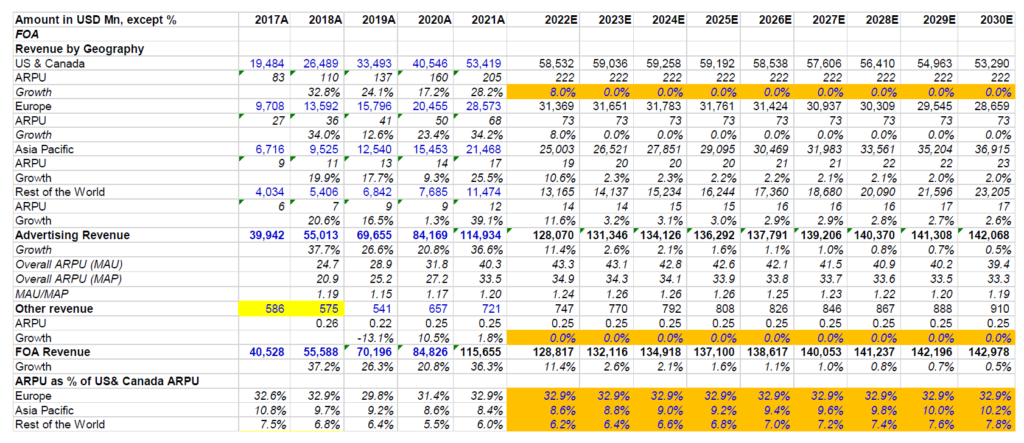
Let’s talk about ARPU now. Please note for FOA ARPU, I have used Facebook’s MAU since Meta does not disclose MAP by geography. Therefore, there is a slight mismatch between numerator and denominator when it comes to calculating ARPU (nothing too material though) i.e. the numerator takes into account of revenue from Facebook, Instagram, WhatsApp, and Messenger whereas the denominator is just Facebook’s MAU.
Monetization in the US market had been incredibly strong over the last five years despite the lukewarm DAU/MAU trend. If we look at other regions ARPU as % of US & Canada ARPU, interestingly monetization in other regions remained somewhat constant as % of US & Canada ARPU. I have assumed zero growth in ARPU from 2023-2030 in the US and Europe, and only a very low single digit growth in Asia Pacific and Rest of the World. The numbers here perhaps imply Apple’s ATT restrictions will be a permanent headwind and Meta’s attempt to solve it will largely fail. One could also argue that if DAU/MAU really starts falling, it may be challenging for Meta to retain similar ad budgets from its advertisers and hence even keeping the current ARPU may be difficult. However, what the ARPU also implies is Reels and WhatsApp monetization plans may not also work out as well as Meta expects. Overall, as per this model, following this year revenue growth in FOA will be almost non-existent for the rest of this decade.
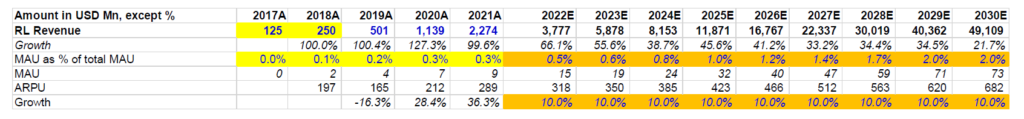
How about RL or the metaverse bet? This is basically a venture bet, I’m sure we all understand how difficult it is to put numbers behind venture bets. Whether the bet is successful or a failure, one thing is certain whatever model we build today for RL will prove to be wrong. With that caveat in mind, let’s dig into it. Meta started disclosing RL’s numbers in 2021 and we only have last three years’ numbers; therefore, 2017 and 2018 numbers are estimated. I estimated 2% of Facebook’s MAUs to be RL’s MAU in 2030 which comes out to be ~70-75 Mn. Because RL revenue consists of hardware (which itself drives supermajority of revenue; a Quest 2 costs $299/$399 each today), software, and content, ARPU is significantly higher compared to FOA. As a result, ARPU in 2030 turns out to be $682. I’m sure many of you are rolling your eyes looking at ~$50 Bn revenue in RL segment in 2030. In 2010, Meta reported ~$2 Bn revenue which is RL’s revenue today. In 2021, Meta reported ~$118 Bn revenue. I know, I know you cannot build Facebook every decade which is perhaps once in a generation company. In any case, even if you think ~$50 Bn is preposterous number, bear with me, and let me come back to this point again later.
Cost structure:
To understand Meta’s cost structure in a more granular level, I have tried to segregate into FOA and RL’s costs. Please note that Meta does not report segment level costs, but do report segment level operating income. Therefore, I tried to make assumptions in a way that get us close to the reported actual operating income (loss) for each segment.
Because RL used to have negligible contribution to overall Meta in 2017, I considered 2017 as a guide for FOA costs in later years. While projecting FOA costs, I modeled a slight benefit of scale when seen from 2021 cost structure, but if you notice the historical cost structure, I did not assume much scale benefit at all. For RL, again, this is anyone’s guess what the eventual economics will look like. Meta is currently incurring heavy losses which I rationalize over the years to reach 40% gross margin in 2028, and a breakeven EBIT in 2028. In 2030, RL’s gross margin and EBIT margin are assumed to be 50% and 10% respectively. Theoretically, the hardware component will be low margin and software/content revenue is likely to be higher margin. As more advanced version of VR headsets arrive and sophisticated AR glasses are launched, hardware may not suffer commodity like margin, but this is perhaps impossible to predict, given a lot depends on upcoming competition from other big tech and beyond. Of $682, if we assume hardware is $400 and is sold at ~25% gross margin and the rest software/content revenue is sold at ~80% gross margin, the overall gross margin per user is ~50%. For the rest of the cost structure within RL, I assumed gradual improvement that one can expect to see once the topline scales a bit.
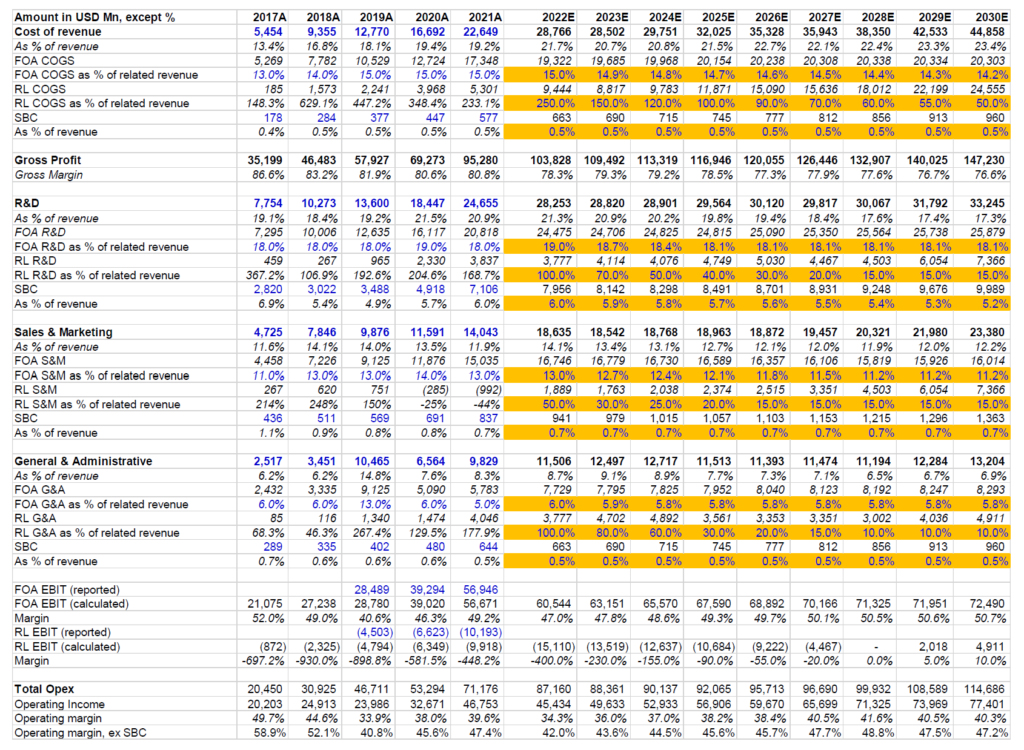
Going back to the earlier point on RL’s topline projection, whether you believe $50 Bn topline is possible matters perhaps lot less when you see it through the cost structure perspective. In this model, I have assumed RL to burn $90 Bn cash from 2017-2027 which is likely to be the highest cash burn in the history of capitalism for a “venture bet”. For all these cash burns, I assumed ~$5 Bn EBIT in 2030. I believe it is difficult to consider these assumptions aggressive unless of course, Zuck just decides to keep incinerating cash even if RL’s topline shows no sign-up momentum.
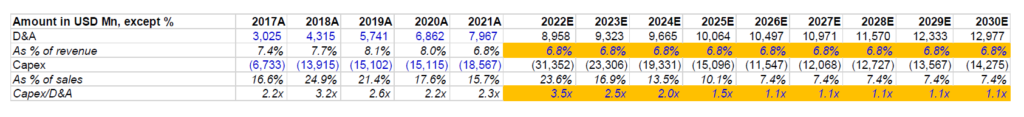
Capex: Meta has been in a heavy-capex cycle for quite some time, as indicated by Capex to depreciation ratio which has been consistently above 2.0x. Of course, this cannot continue for forever, and capex to depreciation ratio is expected to be 1.1x-1.2x in the long-term (the 10-20% premium is expected to incorporate future inflation as you upgrade your infrastructure in the future). I didn’t assume Meta would get there in two-three years, but in five years.
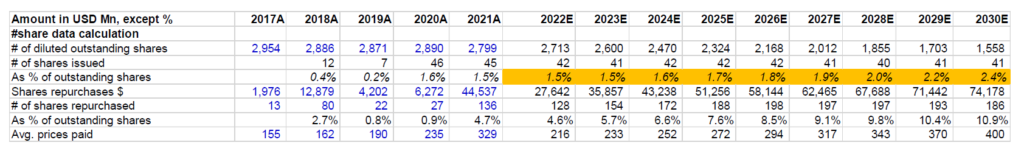
Buyback and share dilution: While Meta mostly focused on offsetting dilution in the past, in 2021 they changed gears materially by repurchasing ~5% of diluted outstanding shares. Going forward, I assumed 100% of FCF to be deployed in buying back shares from the market. Meta still has ~$48 Bn cash in balance sheet which is assumed to be unutilized for buybacks and can be deployed for future acquisitions if Lina Khan ever decides to give them a pass (don’t count on it). For stock-based compensation, I assumed similar stock issuance as Meta did in the last couple of years. It is possible Meta may decide to dole more shares to its employees this year given the hit stock recently took, but such decisions are unlikely to be floor for stock issuances in the future. ~20-30 mn extra stock issuances in one-off year do not have material impact on the valuation.
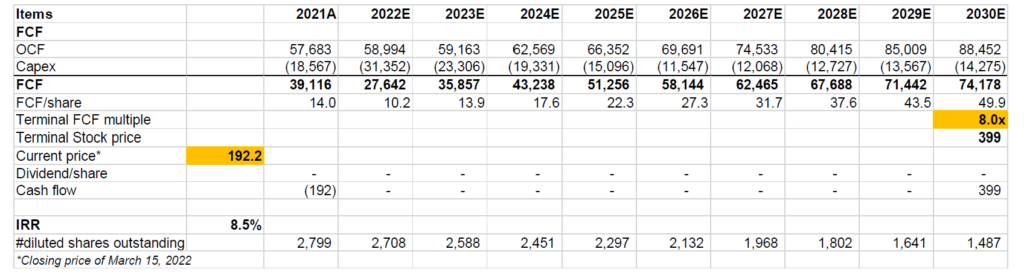
Valuation: After taking all that into account, I needed to use 8x FCF multiple in 2030 to get ~8% IRR. Please note #of shares is assumed to decrease by ~45% by 2030. Again, I strongly recommend you to download the model and play with the assumptions you deem appropriate. You don’t have to agree with any of my assumptions.
Final words: When Zuck decided to go big on his bet on Metaverse in November last year, I became more cautious since the range of outcomes for Meta widened because of such material increase in expenses on an inherently uncertain bet. As stock price plummeted since then and I also got more opportunity to learn more about VR’s potential, I decided to do this exercise to figure out what’s really embedded in today’s stock price. Based on these numbers discussed in this write-up, I think Meta appears to be a fat pitch to me (but please note even fat pitches do have risks as I alluded here), and hence I decided to increase my weight in META from ~7% to ~12% over the last week.
I will publish my deep dive (both narrative and numbers; not just numbers) on Constellation Software on Monday next week (21 March, 2022). Thanks for reading.
Subscribe to receive the deep dives in your inbox. The companies covered so far are: Uber, Etsy, Lululemon, Angi, Ansys, Autodesk, Copart, Shopify, Otis, CrowdStrike, Roku, Boeing, Square, Trupanion, RH, Spotify, Pinterest, and Twilio
Disclaimer: All posts on “MBI Deep Dives” are for informational purposes only. This is NOT a recommendation to buy or sell securities discussed. Please do your own work before investing your money.