Market Bubble Talk, Frozen Housing Market Implications
Ever since I started investing in the US in 2018, I have consistently heard about valuation being in “bubble” territory. Early 2023 was perhaps the only time I can recall the bubble talk was a bit subdued, but then again, a recession in 2023 was thought to be on the cards. Sometimes when I look back at the prices and multiples many of the “compounders” used to trade at during early 2010s, it feels investors were playing such an easy game. Companies such as Visa, Sherwin Williams, Google, Union Pacific…some cherry picked compounders from four very different industries, but they all traded around mid-teens earnings multiple!

The bets on compounders seem lot less straightforward these days! While Google and Union Pacific’s multiples stay somewhat grounded, Visa and Sherwin Williams unlikely to enjoy any material tailwind from multiple expansion going forward.

Of course, there is always something to worry about. While today we know Google had enormous runway left for global domination, there were legitimate concerns around transition to search on mobile. With GFC still fresh on everyone’s memory, the fear of double dip global recession (Eurozone crisis also didn't help) was likely quite vivid among most investors’ mind. So, it is highly likely that even if I was investing back then, I may not have quite felt like a kid in a candy store.
In any case, given the frequency of proclamations around market being in a “bubble” territory, I am admittedly deeply suspicious of any kind of bubble talk. I do think there’s always some bubble in some corner of the market, but a broad market level valuation bubble is historically incredibly rare. Of course, if China invades Taiwan tomorrow, the broad index may go down ~30% perhaps in a week. That’s not a sign of valuation bubble though; it’s just “Taiwan risk” is not being captured in price. To say it differently, even if S&P 500 were 20% below today’s level and China invaded Taiwan, I imagine the index would still go down somewhere between 20-30% in a week.
It is incredibly simplistic to look at historical market level multiples and think current index is trading at such and such percentile compared to past 30, 50, or 100 years without not looking at nuances embedded in the index. We may be looking at S&P 500 index, but the index “portfolio” is incredibly dynamic over time, and hence looks dramatically different over 30-50 year period.
We did, of course, see a true valuation bubble over the index level back in early 2000s. S&P 500 experienced a lost decade in the first decade of this century. But you know what, I always found it to be quite instructive that broader market needed to experience TWO largely unrelated massive jolts for investors in the US market to experience a lost decade! Perhaps index could still eke out LSD-MSD type return DESPITE market being in such an obnoxious bubble in early 2000s if there were no GFC. LSD-MSD CAGR is clearly a bad outcome in most market environments, but probably not nearly as bad when market is recovering from an absolute mania.
While we have started hearing about current market environment being similar to the tech bubble, I think there are still more differences than similarities between these two periods. I do feel a bit hesitant to point out the early 2000s tech bubble period to claim “hey, we aren’t that crazy yet”…that’s hardly reassuring!
I did come across some numbers from Patient Capital Management that contextualizes the tech bubble vs current period:
“The S&P 500 at 22x forward twelve-month earnings is ~15% cheaper than the peak of the tech bubble at 25.5x despite having 60% higher profit margins and 10% better ROE.
Market concentration today looks much more aligned with fundamentals. During the tech bubble, the concentration of the top 10 largest stocks at 27% was nearly 2x above its earnings contribution. The expected earnings growth that was priced in failed to materialize. Today, the weight of the top 10 stocks relative to their earnings contribution is much more aligned at 35% and 32%, respectively. While the top 10 stocks in the S&P at 38.3x is above the tech bubble at 34.4x, Tesla at 145x is meaningfully skewing the data. Excluding Tesla, the top 10 today trade at 26.5x, or ~25% below the tech bubble peak despite returns on capital that are >2x higher.”
The real bear case for the broad index is increasingly related to AI. If all these AI capex leads to quite sub-par return, the mag7 earnings will prove to be overstated as depreciation will keep rising over time without much commensurate gain in revenue and profits! I am obviously playing close attention to this debate, but I don’t quite think we need to be worried…yet!
Frozen Housing Market Implications
Last week, WSJ published an interesting piece about the implications of frozen housing market and the ripple effects it is causing in various ways. Some excerpts from the piece:
The frozen housing market means growing families can’t upgrade, empty-nesters can’t downsize and first-time buyers are all but locked out. When people can’t move for a job offer, or to a city with better job opportunities, they often earn less. When companies can’t hire people who currently live in, say, a different state, corporate productivity and profits can suffer.
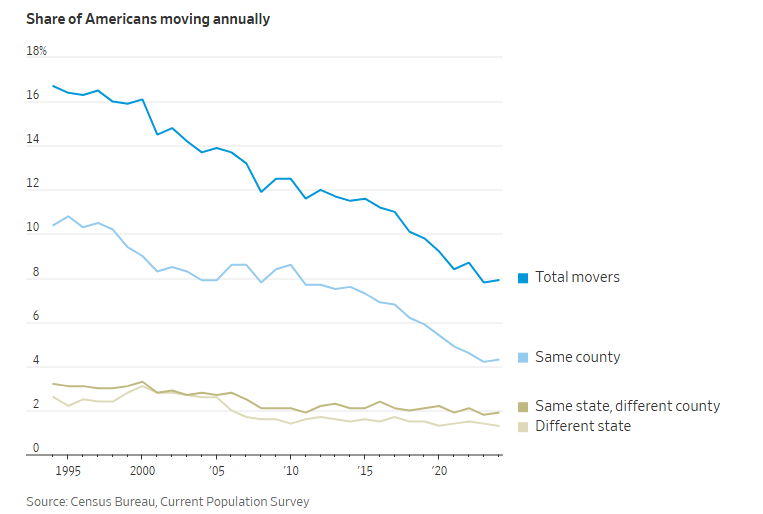
In the 1950s and ’60s, some 20% of Americans would typically move each year.
The share of people moving has steadily slowed since then, in part because the U.S. population has aged, and older people tend to move less. More Americans also live in households with two earners, which makes uprooting more challenging.
By 2019, the year before the Covid pandemic, 9.8% of Americans moved.
During Covid, there was a well-publicized increase in people decamping farther away from work and deeper into the suburbs. That surge was brief. In 2023, only 7.8% of Americans moved, the lowest rate logged since U.S. Census records began in 1948. That figure held relatively steady in 2024, the most recent data available.
If people feel locked in their current house and can’t upgrade because they cannot afford the mortgage payments, I wondered if it can affect fertility rate. This NBER paper did seem to confirm my intuition: “a 10 percent increase in home prices leads to a 1 percent decrease in births among non-homeowners in an average metropolitan area. However, the negative effect among non-owners is offset by a 4.5 percent increase in births among current homeowners, who are now wealthier.”
I also wondered about political polarization deepening over time if the composition of the county/city/state remain more or less the same for decades. Regions can become stronger echo chambers, making national consensus and political compromise increasingly difficult to achieve. Reading the WSJ piece made me appreciate that the housing affordability crisis can become a top-tier political issue in coming years (even more so than it is today). The "correct" solution may become a major battleground for political parties, and I suspect we will see plenty of bad ideas (e.g. rent control, increasing pressure on Fed to lower rates regardless of the data) as potential solutions. I don’t have any company specific point (although I do suspect this may be good for home improvement retailers?), but I wanted to highlight this as it may prove to be important in sociological and political context in the next few years.
In addition to "Daily Dose" (yes, DAILY) like this, MBI Deep Dives publishes one Deep Dive on a publicly listed company every month. You can find all the 61 Deep Dives here.
Current Portfolio:
Please note that these are NOT my recommendation to buy/sell these securities, but just disclosure from my end so that you can assess potential biases that I may have because of my own personal portfolio holdings. Always consider my write-up my personal investing journal and never forget my objectives, risk tolerance, and constraints may have no resemblance to yours.
My current portfolio is disclosed below: