Why I sold Etsy
Subscribe to receive future posts in your inbox
I first bought Etsy in September 2020 at $111/share and continued to add to my position later to make it my largest holding (~15% of portfolio) at an average cost of $128/share. Following my first purchase, I published a deep dive on Etsy in October 2020 and wrote multiple twitter threads as I kept following the company closely. I now believe I had materially overestimated the strength of the marketplace and in my original deep dive, I got the unit economics of an active buyer simply wrong. I sold my entire position on Etsy yesterday at $214/share. I am not short Etsy (in fact, I have not shorted any stock ever) and this is NOT a recommendation to either sell or short Etsy. I am merely sharing my thoughts on the company, and you can, of course, come to very different conclusions than I did. Since my original deep dive (and all twitter threads) remains open for anyone to read, I have decided not to keep my current thoughts on Etsy behind paywall.
On this update, I will explain a) why I started second guessing my earlier work on Etsy, b) how I currently think about active buyers and the marketplace, and c) walk you through my modeling assumptions and show you my work to elaborate why I am uncomfortable remaining a shareholder of Etsy.
Why I started second guessing my earlier work on Etsy
In my original deep dive, I used the cohort data published in Etsy’s 10-K to work on the unit economics. Since the deep dive was published in October last year, I had the 2019 10-K in hand, and hence utilized the following cohort data (see page 9 of 2019 10-K).
Let me explain how I originally interpreted the below graph using the 2016 buyer cohort as an example. Before you read my interpretation, I encourage you to read the below statement +graph first and come up with your own interpretation.
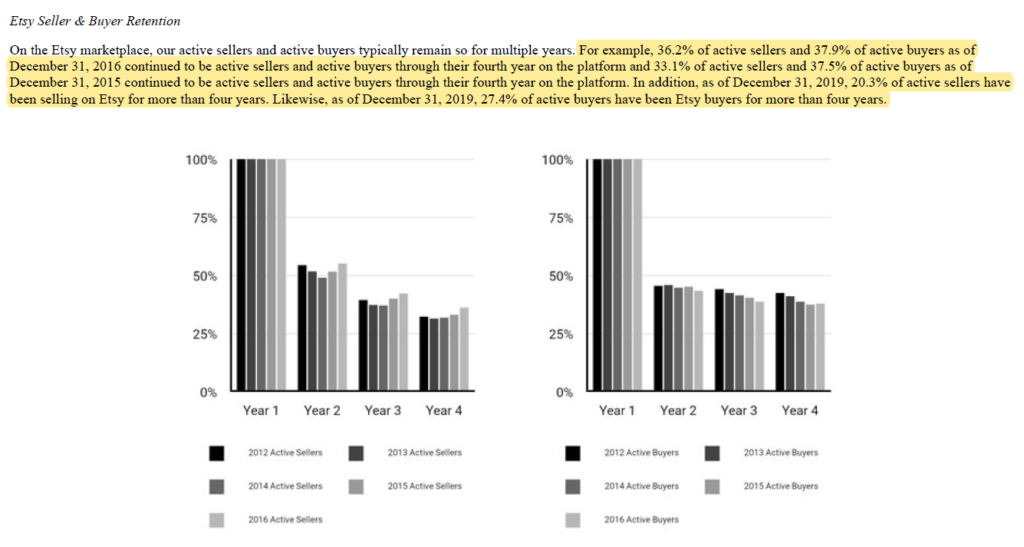
Here’s what I thought: I assumed the “2016 active buyers” as anyone who bought anything on Etsy either for the first time or reactivated after a lapse of 12 months or more in 2016. Let’s assume, for the sake of simplicity, “2016 active buyers” consisted of 100 buyers. In 2017, ~45% of these “2016 active buyers” i.e. 45 buyers shopped again at Etsy. In 2018, ~40% of “2016 active buyers” i.e. 40 buyers shopped at Etsy, and in 2019, ~37.9% of “2016 active buyers” i.e. ~38 buyers (see the yellow lined statement above) found something to buy at Etsy. The original interpretation was that even though there is a material (~55%) buyer churn in year 2, the ones who stick in year 2 turn out to be very sticky buyers as an overwhelming majority of them continued to shop at Etsy for four consecutive years.
Recently, I wrote a twitter thread to respond to bear concerns on Etsy and expressed skepticism on the strength of the bear case. However, following the thread, I had multiple exchanges with a few people which led me to ask Etsy’s Investor Relations (IR) for some clarification on the interpretation of the aforementioned chart. I have exchanged multiple emails over the last week with IR and received multiple confirmations of what Etsy intended to mean.
So, what is the correct interpretation? Let’s continue with our “2016 active buyers” example which is again assumed to be 100 buyers. Of these 100 buyers, ~45% i.e. 45 buyers shopped again in 2017. In 2018, however, 40% of “2016 active buyers” who also bought in 2017 i.e. only 18 buyers shopped at Etsy again. In 2019, only 7 of the “2016 active buyers” shopped at Etsy for four consecutive years. I have shown below the incorrect (my previous interpretation) and correct interpretation of the cohort data below.
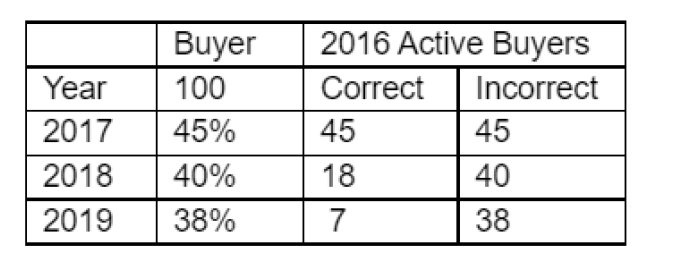
Essentially, the graph applies ONLY to “consecutive buyers” i.e. if “2016 active buyer” shopped in 2017 (year 2) but didn’t shop in 2018 (year 3), the buyer is NOT included at all in this graph even if he/she shopped again in 2019. I will be very surprised if any of my readers was able to infer this “correct” interpretation by reading/looking at the graph on their own. I have looked at many cohort/retention data published by publicly listed companies, but I cannot recall any company which defines it the way Etsy does. In fact, considering I myself run subscription-based research service, Stripe reports subscriber cohort level data by month and Stripe too defines the way I originally interpreted Etsy’s data. Given that tech companies seem to define some of these very common metrics not in a standardized manner, I am probably not the first analyst to misinterpret a metric.
I, however, was confounded by the following statement from the paragraph shared earlier: “36.2% of active sellers and 37.9% of active buyers as of December 31, 2016 continued to be active sellers and active buyers through their fourth year on the platform”
In my mind, there is really one possible interpretation of this sentence and hence, I asked for clarification again. This time IR confirmed that this particular sentence is not indicating to the graph shared right below that statement. While the graph only applies to “consecutive buyers”, the statement applies for both consecutive and non-consecutive buyers i.e. 37.9% of “2016 active buyers” indeed shopped at Etsy in 2019, but it includes buyers who shopped each of the 2016-2019 years AND buyers who may not have bought anything at Etsy in 2017 and/or 2018 but did buy in 2019. If this feels confusing, it is because it is indeed confusing. What I find curious is even though IR mentioned that the statement and the chart are not related and hence should be considered separately, the data from the graph seems to align really well with the aforementioned statement in each of the 10-Ks in the last five years.
For what it’s worth, Etsy’s IR seemed to understand how this is all confusing and mentioned to me that “we're looking to revamp how we present cohorts. We inherited this view and decided to keep it consistent for comparison.”
So what does this all mean? First of all, it means my previous analysis on unit economics of an active buyer is, in no uncertain terms, wrong. I also inferred that I needed to re-think how to think about “active buyers” and consequently the marketplace based on this new understanding.
How I currently think about active buyers, and the strength of the marketplace
Before I explain how I think about active buyers now, I would like to highlight all of my work is based on publicly available information. I just started re-thinking my work after I got to understand the correct interpretation of retention data mentioned in Etsy’s 10-K.
Active buyers can be categorized in three separate segments: a) new buyers, b) re-activated buyers, and c) consistent buyers. Let me define each of these segments and explain the numbers mentioned in the table below.
New Buyers
A “new buyer” is someone who buys something from Etsy for the first time in his/her life. Etsy started disclosing “new buyer” data from 2018, so we have company reported data from 2018-2020. From 2013-2017, the data that you see below are my own assumptions. While I obviously don’t know how close to the reality my assumptions are, I believe I am not off the chart by miles.
Re-activated buyers
A “re-activated buyer” is someone who, for example, bought something from Etsy in 2020 but did not buy anything in 2019 (or the Last Twelve Months/LTM). This buyer bought at least one item from Etsy at some point in their lives (could be 2008 or 2018). In 2020 10-K (see page 73), Etsy mentioned “The Etsy marketplace saw an influx of 60.7 million new buyers and reactivated buyers during the year, the latter being those who haven’t purchased in a year or more.”
Since we know there were 38 mn new buyers in 2020, we can easily calculate that there were 22.7 mn re-activated buyers in 2020. Etsy did not mention or report “re-activated buyer” data before 2020, so I had to assume the data for 2013-2019 period. The reason I used T-2 years to calculate re-activated buyers as a % of T-2 Active buyers is if a buyer in T-1 year shops in year T, he/she cannot be considered for re-activated buyer pool for year T. Only the buyers who shopped any time before or in T-2 years can be in the pool of potential re-activated buyers. Again, I do not know how correct I am with my assumptions, but I believe these should be around the ballpark for most years.
Consistent buyers
A “consistent buyer” is someone who has bought something from Etsy for the last two consecutive years. This is a term I myself came up with; Etsy does not report/mention/define any active buyer category like this. Ultimately, if you are not a “new buyer” and not a “re-activated buyer”, you are a consistent buyer. To drive this point home, let me give examples. If a buyer bought something in 2017 but didn’t buy anything in 2018 and yet bought something in 2019, he/she is re-activated buyer, not consistent buyer. A “2018 consistent buyer” is someone who bought something in both 2017 and 2018, but if this same buyer did not buy anything in 2019 and then chose to buy in 2020, he/she is considered “re-activated buyer” in 2020. As a result, consistent buyer churns all the time, goes to re-activated buyer bucket, and then has the potential to go to “consistent buyer” bucket.
Since Etsy reports its total active buyers and we either know or assumed new buyers and re-activated buyers number, we can easily calculate “consistent buyers” (Active buyers- new buyers- reactivated buyers).
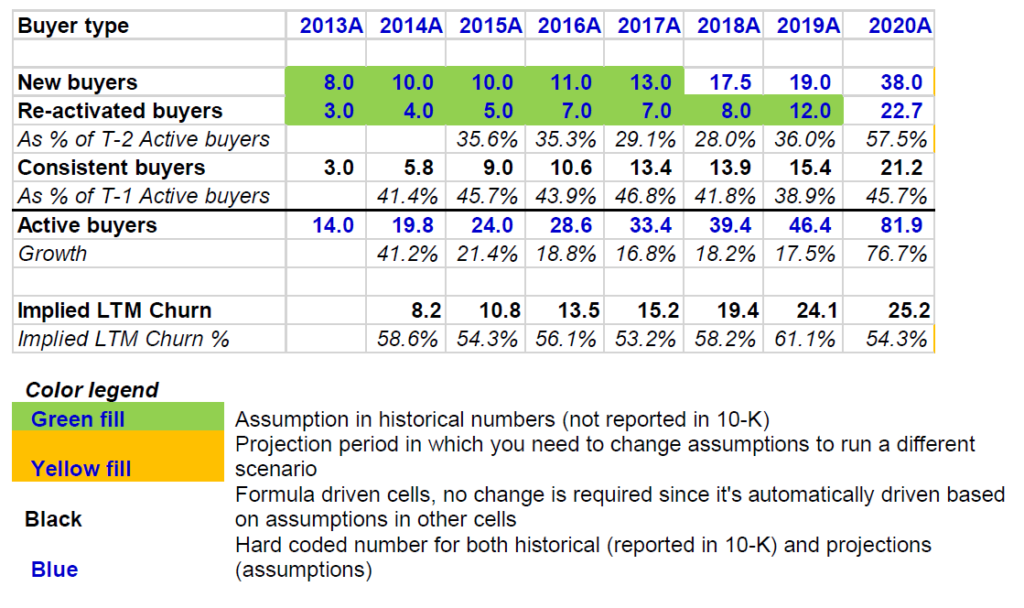
Now that we understand different buyer categories, let me explain “Implied LTM Churn”. This data is also not reported by Etsy. In T-1 year, each of the three buyer-categories has a chance to either become or remain a “consistent buyer” in year T. Therefore, if they do not become part of “consistent buyer” in year T, it implies he/she has churned from the marketplace. Consequently, I calculated “Implied LTM Churn” as “T-1 Active Buyer – Consistent Buyer in year T”. Churn rate or churn % is calculated as Implied LTM Churn divided by T-1 Active Buyer.
If this still seems confusing, I strongly encourage to download the excel model and spend some time on “Buyer” worksheet.
What do we see from this data? We see that churn is consistently greater than 50% in each of the last 8 years, even during Covid-19. While re-activated buyers were typically 30-35% prior to pandemic, clearly Covid-19 had incentivized many of the churned buyers to come back to the marketplace. What it essentially depicts is Etsy’s marketplace appears to be weaker than I thought earlier. Even though number of sellers increased by almost 200% in the last 5 years, it does not seem to have a noticeable impact in the churn. Buyer loyalty seems weak and when you triangulate with the “correct” interpretation I explained earlier, it seems a very small group of buyers come back to Etsy every year and the rest are promiscuous in their shopping habits to the extent that they may not even remember Etsy for year(s).
Of course, the fact remains Etsy is a capital-light high margin business. So what does all this mean for valuation? Let’s get to the modeling assumptions and valuation discussion then.
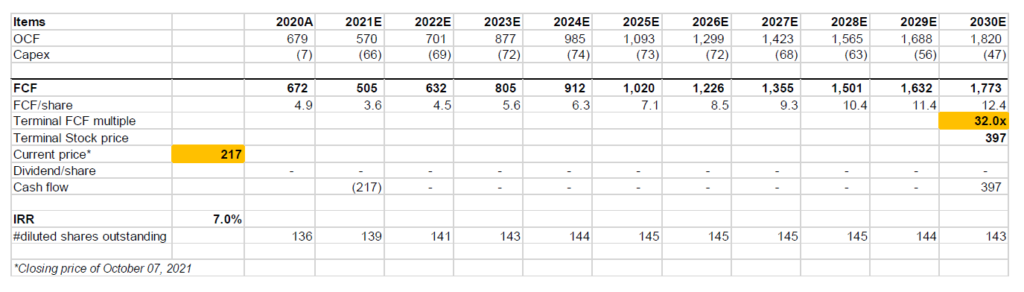
Valuation/Model assumptions: If you are reading my work for the first time, I encourage you to read my piece on “approach to valuation”. I follow an “expectations investing” or reverse DCF approach and try to figure out what I need to assume to generate a decent IRR from an investment (in this case ~7%). Then I glance through the model and ask myself how comfortable I am with these assumptions. As always, I encourage subscribers to download the model and build your own narrative and forecast as you see fit to come to your own conclusion.
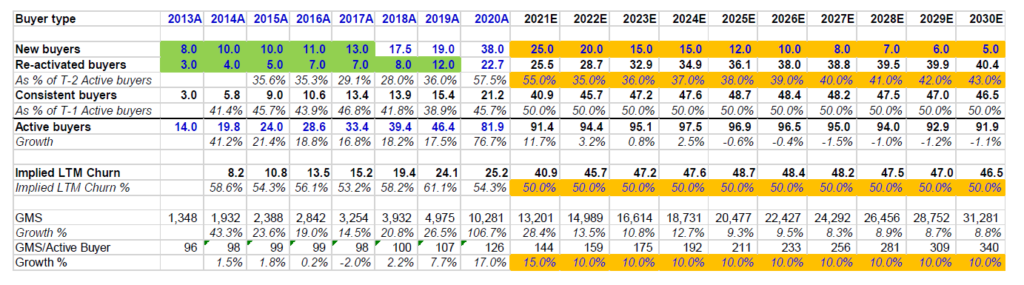
Let’s start from where we have left off in the earlier section. Let’s drill down further in Active buyers. As I have just explained the historical numbers (please see color code shared earlier), I’ll primarily focus on my thoughts behind the projections to figure out the expectations embedded in the current stock price. Considering the year 2021 is almost complete and we have fairly narrow range of outcomes, let’s mostly ignore that year as well.
For new buyers, at first glance, it may appear I am conservative in my estimates. But think about the definition of “new buyer”, someone who is buying from Etsy for the first time. If I add all the new buyers from 2013-2030, we get to ~250 Mn people. If we keep adding 15-20 mn “new buyers” each year in the next 10 years, we will simply run out of people in the US. But Etsy bulls (and my former self) would argue and point out the international opportunities for Etsy. The problem is even though “international GMS” was 36% of overall GMS in 2020, we don’t have a good idea how many “international buyers” are truly “international” since as per Etsy’s definition of “international GMS”, if either buyer or seller is from outside the US, it is considered “international GMS”. Therefore, if a New Yorker orders jewellery from UK, it is part of “international GMS”. It is possible that Etsy may become a big marketplace in multiple countries and may surprise me by continuing to add >10 mn new buyers throughout this decade.
For re-activated buyers, I assumed 35% of 2020 active buyers will become re-activated buyers in 2022 and then increase it by 100 bps every year till 2030. Please note that barring 2020, there was never a time when Etsy was able to re-activate more than 36% of its T-2 active buyers. Therefore, this assumption appears somewhat aggressive to me.
Consistent buyer is basically just the opposite side of churn. If you do not churn, you become consistent buyer and if you do churn, you go back to the potential pool of re-activated buyers in future years. Again, if you see closely, when we assume Etsy will manage to convert 50% of T-1 active buyers as consistent buyers in each of the next 10 years, it means we are assuming something Etsy was not able to do anytime in the past (based on my assumptions). This too does not appear a conservative assumption to me.
Total Active Buyers is just sum of these three buyer categories.
Now that we have total active buyers, let’s talk about Gross Merchandise Sales (GMS) per active buyer. Before 2019, Etsy’s GMS/active buyer was consistently growing at low single digit rate. Josh Silverman, after becoming CEO in May 2017, turned the ship around and started to show impressive result as GMS/Active buyer grew at 7.7% in 2019 and thanks to the pandemic, 2020 was off the charts. Now let’s look at the future. I basically had to assume GMS/active buyer will grow consistently at 10% from 2022-2030 to reach ~$30 Bn GMS in 2030.
Ultimately, if my number of active buyer projections are in the ball-park, Etsy shareholders need to believe that frequency of purchase by active buyers will materially increase.
As it happens to be the case, In Practise recently interviewed a former Etsy employee and asked this exact question, “Do you think Etsy can improve the frequency and repeat buying over time, or is there a limit…?”
The response did not drive much confidence: “…Can it be done? Nothing’s impossible. Did we ever see success in moving that metric? No.”
Let me now mention what other changes I made in my Etsy model. I kept gross margin assumptions the same and I kept the operating leverage I modeled for G&A and R&D. However, considering Etsy consistently experienced 50-60% buyer churn every year, I now think Etsy may not enjoy much scale benefit in Sales & Marketing (S&M). As a result, my S&M assumptions (29% of sales) in out years are now more conservative compared to the model I shared earlier. Given decreased margin assumptions, I also had less cash to deploy buybacks in my current model.
As you navigate my model, please don’t fixate on my estimates vs consensus on any particular year and rather focus on the long-term assumptions embedded in the model. To generate ~7% IRR, I needed to assume 32x terminal FCF multiple. What I would like to highlight here is it is not that I was uncomfortable with any one particular driver/assumption on my model; In fact, my discomfort compounded as I felt most of the GMS driver assumptions are aggressive and on top of that, I need to assume 32x FCF multiple to generate ~7% IRR. For context, if we look at eBay, a marketplace which also had its moment in 2000s but had difficulty growing in 2010s, is currently trading below 20x FCF multiple.
While I made a good return on Etsy, it appears in hindsight that this was based on incorrect assumptions/analysis. Had I understood the cohort data and active buyers the way I currently do, I would have sold my position earlier, or may not have initiated a position in the first place. As they say, better be lucky than right.
Can my newfound skepticism for Etsy turn out to be largely unfounded? I certainly cannot rule it out. If I could be wrong once, I can certainly be wrong again. Etsy’s “House of Brands” strategy can turn out to be spectacular if Depop/Elo7 goes on to define their categories. This may all make me look foolish in a few months/years and if it does, I will learn something from that exercise. I strongly encourage you to do your own work, play with the model if you want, and then please come to your own conclusion.
I am currently dropping coverage of Etsy, but as I alluded earlier, if Etsy continues to post soaring operating results, I will re-assess in a year or two to see what I got wrong. Even though I am not a shareholder anymore, my wife already let me know that she will continue to shop at Etsy. Therefore, my household is likely going to be a “consistent buyer”.
Given that I had been busy with Etsy, this month’s deep dive on Trupanion will be slightly delayed and it will be published on October 18th (Monday) instead of October 15th (Friday). Please subscribe to receive it in your inbox. Thank you for your support!
Follow-up thread based on further feedback from readers can be found here.
Disclaimer: All posts on “MBI Deep Dives” are for informational purposes only. This is NOT a recommendation to buy or sell securities discussed. Please do your own work before investing your money.