Enphase Energy: A Solar Roller Coaster
You can listen to the Deep Dive here
If you invested $1,000 in Enphase Energy’s IPO in 2012, you would have only ~$140 left in 2016. That $140, if left untouched, would then become ~$44,000 by the end of 2022, a mind boggling >300-bagger stock in just six short years! And then stock fell down ~70%! If anyone held the stock from IPO to today, any actual rollercoaster ride would probably make them drowsy at this point.
During the due diligence of Enphase, I spoke with an Engineer who did some solar installation work a few years ago. While he was installing solar panels, he started working with Enphase’s microinverters and thought the microinverters were quite easy to install and solved some of the key challenges string inverters typically have (more on this later). After doing some more research, he decided to buy Enphase stock in 2016 which was trading at ~$1.2 at that time. Fast forward to three years later, the stock became ~6-7x and he sold his shares to realize his gains. Given what happened afterwards, he was telling me that he had to stop looking at the stock price at some point and just before our call, he took a look at the stock price and realized he may have missed out on a life changing money.

The whole saga reminded me of Alan Watt’s “The Story of the Chinese Farmer”. It is hard to keep your sanity in the stock market unless you maintain a steady stream of equanimity to your fortunes and misfortunes with a constant drumbeat of “Maybe” on the question of whether something is good news or bad news.
I did, however, mention to him that the skillset required to buy a stock such as Enphase when it was nearly a penny stock (thanks to his ground level experience with the product, he had a clear edge in gauging the potential of Enphase than perhaps most investors) and the skillset required to “dream the dream” to be able to hold the stock are likely to be very, very different. It is extremely rare that they would both be the same investor.
Okay, enough about the stock price. Let’s shift our focus to the business now.
Before I delve into Enphase’s business, I want to have an elaborate discussion on solar industry so that readers have proper context for Enphase’s business and the rest of this Deep Dive.
Section 1 A Brief Overview of Solar
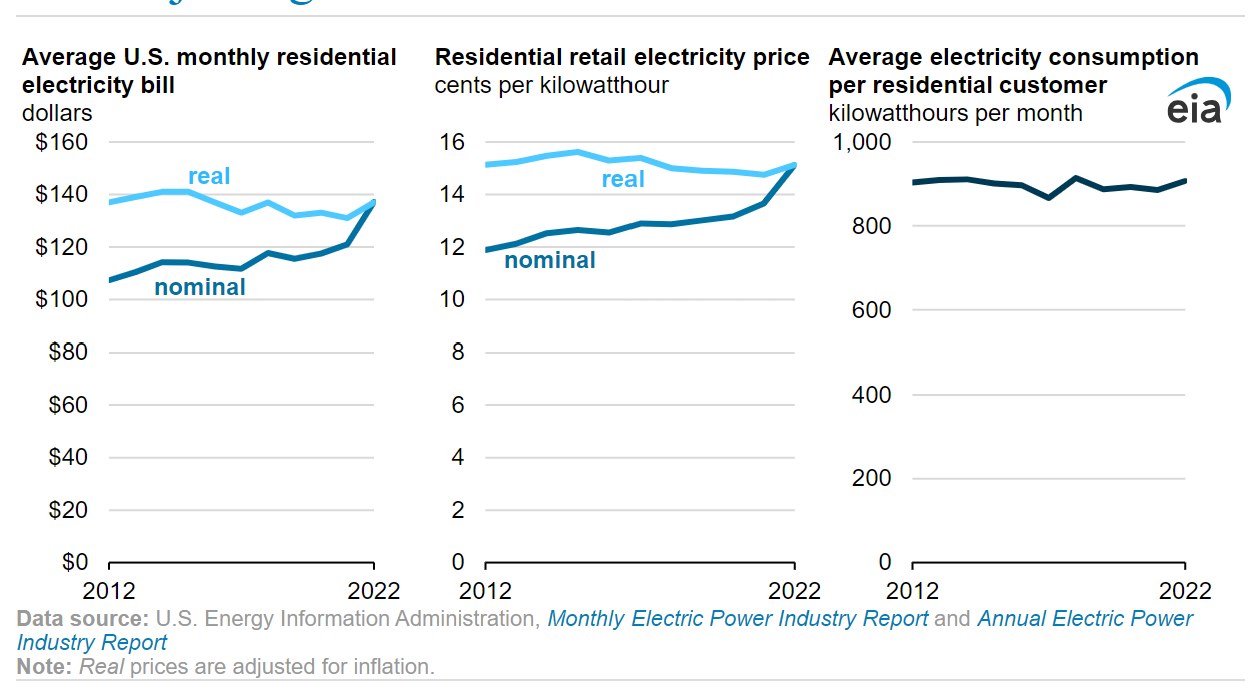
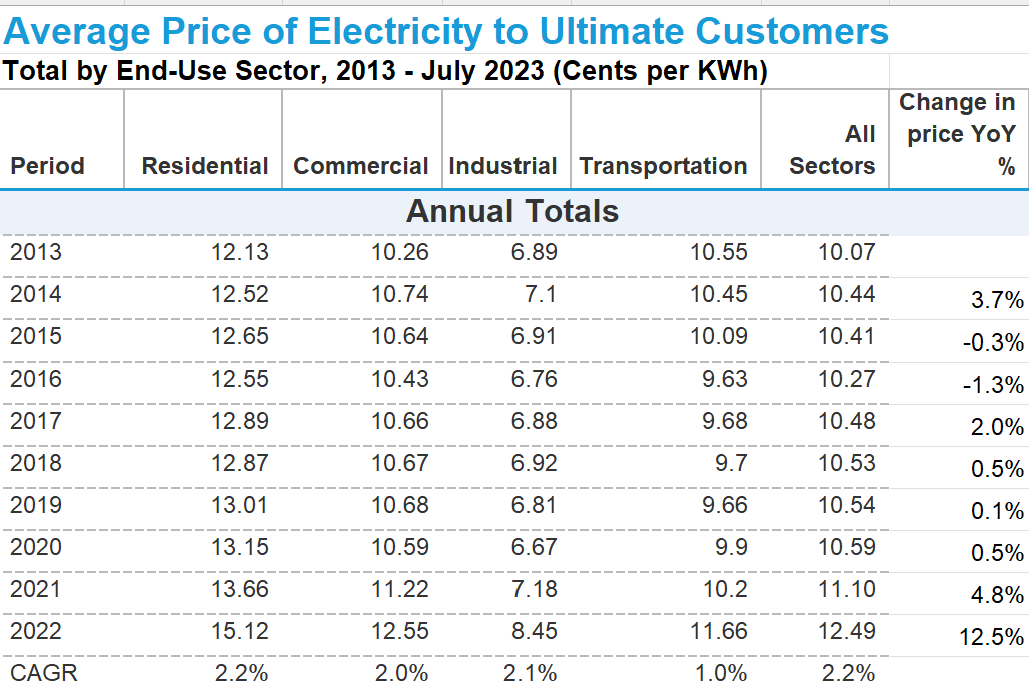
An average US household consumes ~900 kilowatt Hours (KWh) of electricity per month (KWh is a unit of measurement that represents the amount of energy used by an appliance in one hour) and paid ~$140 bill for electricity per month which comes out to be 15.12 cents/KWh in 2022.
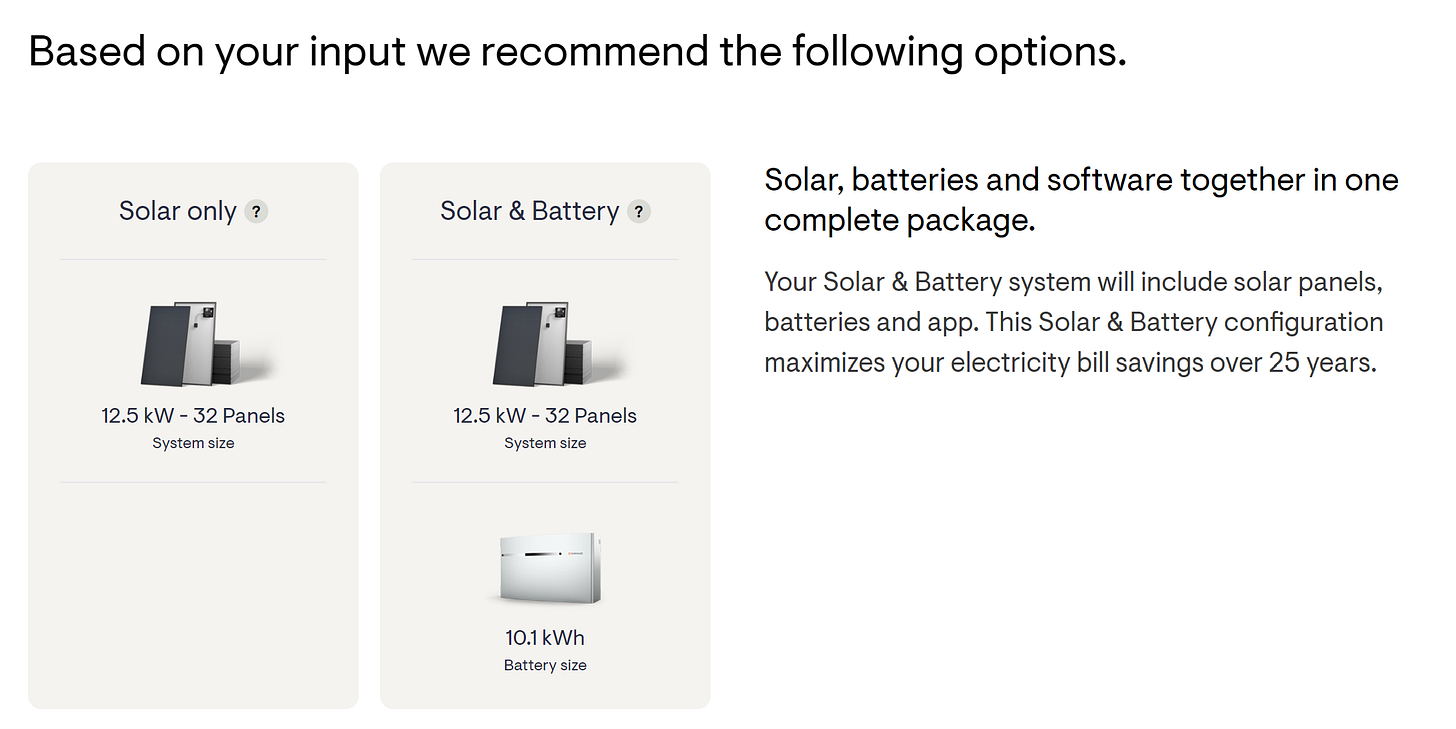
So I went to Enphase website and left some details such as monthly electric bill (I put $150 which is roughly the average electric bill in the US), home address, credit score (>720) etc. to receive a tentative estimate for my cost to install a solar system. Enphase suggested I install 32 solar panels. Since each panel is expected to produce ~390 Watt (W), this suggested solar system will produce ~12.5 KW per hour when the sun is shining.
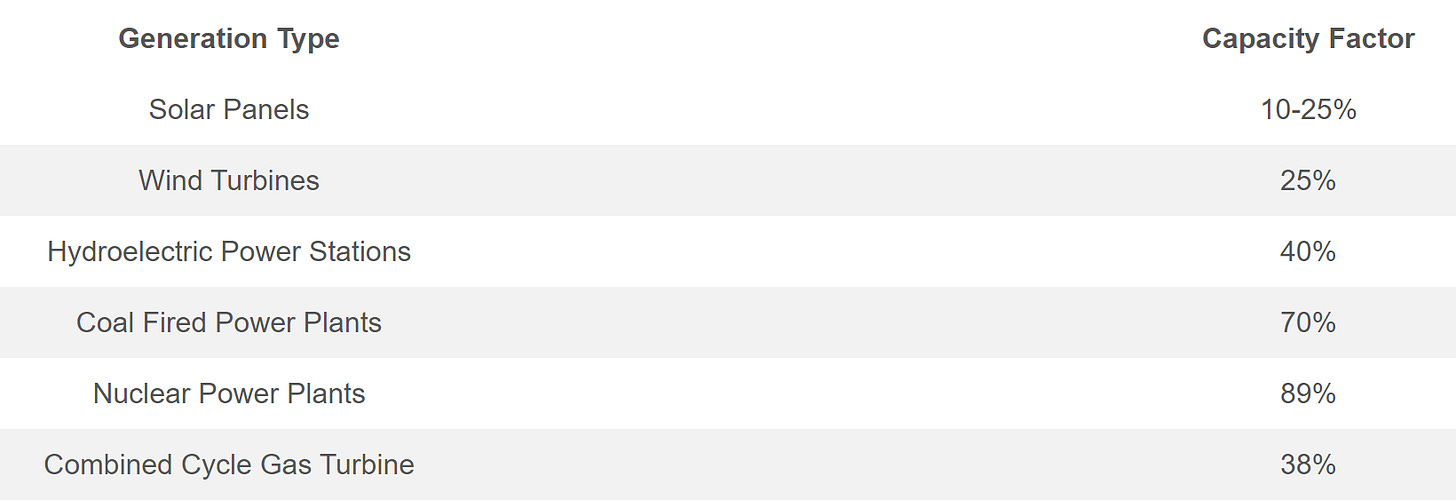
Of course, the sun doesn’t shine all the time. I am currently in Ithaca, NY where the sun shines 4.57 hours per day during summer and only 2.29 hours per day during winter (overall average is 3.79 hours for the year). Solar’s capacity factor, the ratio of energy generated over a period divided by the installed capacity, tends to be the lowest among all other energy generation sources. Depending on the area you live in (sunny or cloudy location), Solar’s capacity factor hovers between ~10-25% whereas coal fired power plants and nuclear power plants have capacity factor of ~70% and ~90% respectively.
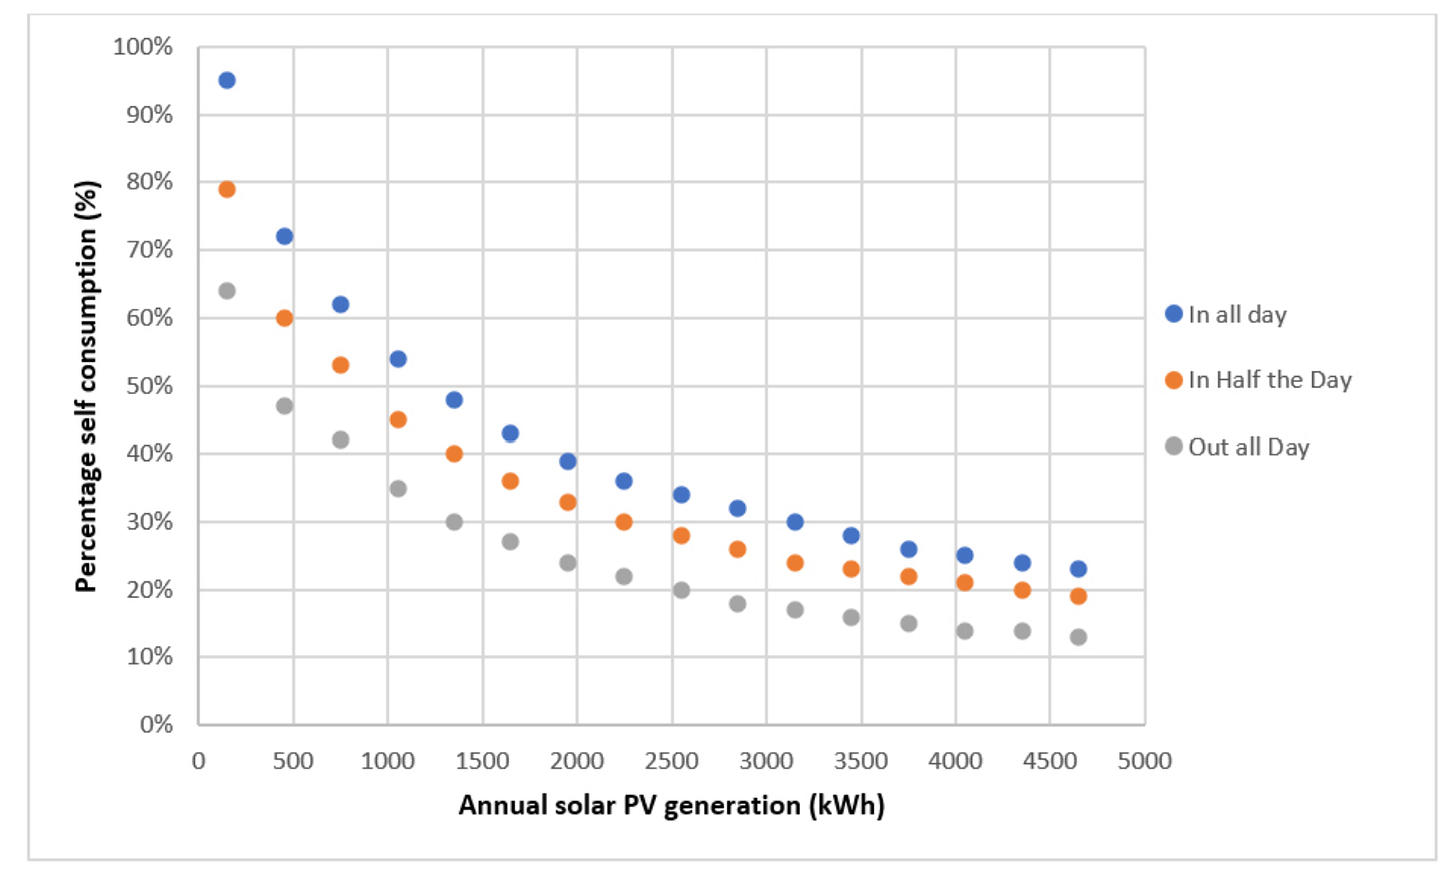
In addition to low capacity factor, there is another challenge with Solar. If you don’t have storage or battery in your solar system, self-consumption percentage (how much of the electricity produced by the solar panels that has been consumed by the household) can be quite low. Self-consumption percentage varies a lot depending on whether you are mostly at home or household members are mostly outside (e.g. at schools or at work). If you are mostly at home, this is likely less of a concern for you. But if you are mostly outside during the day, self-consumption can be as low as 10% and it is hard to justify setting up Solar for your place.
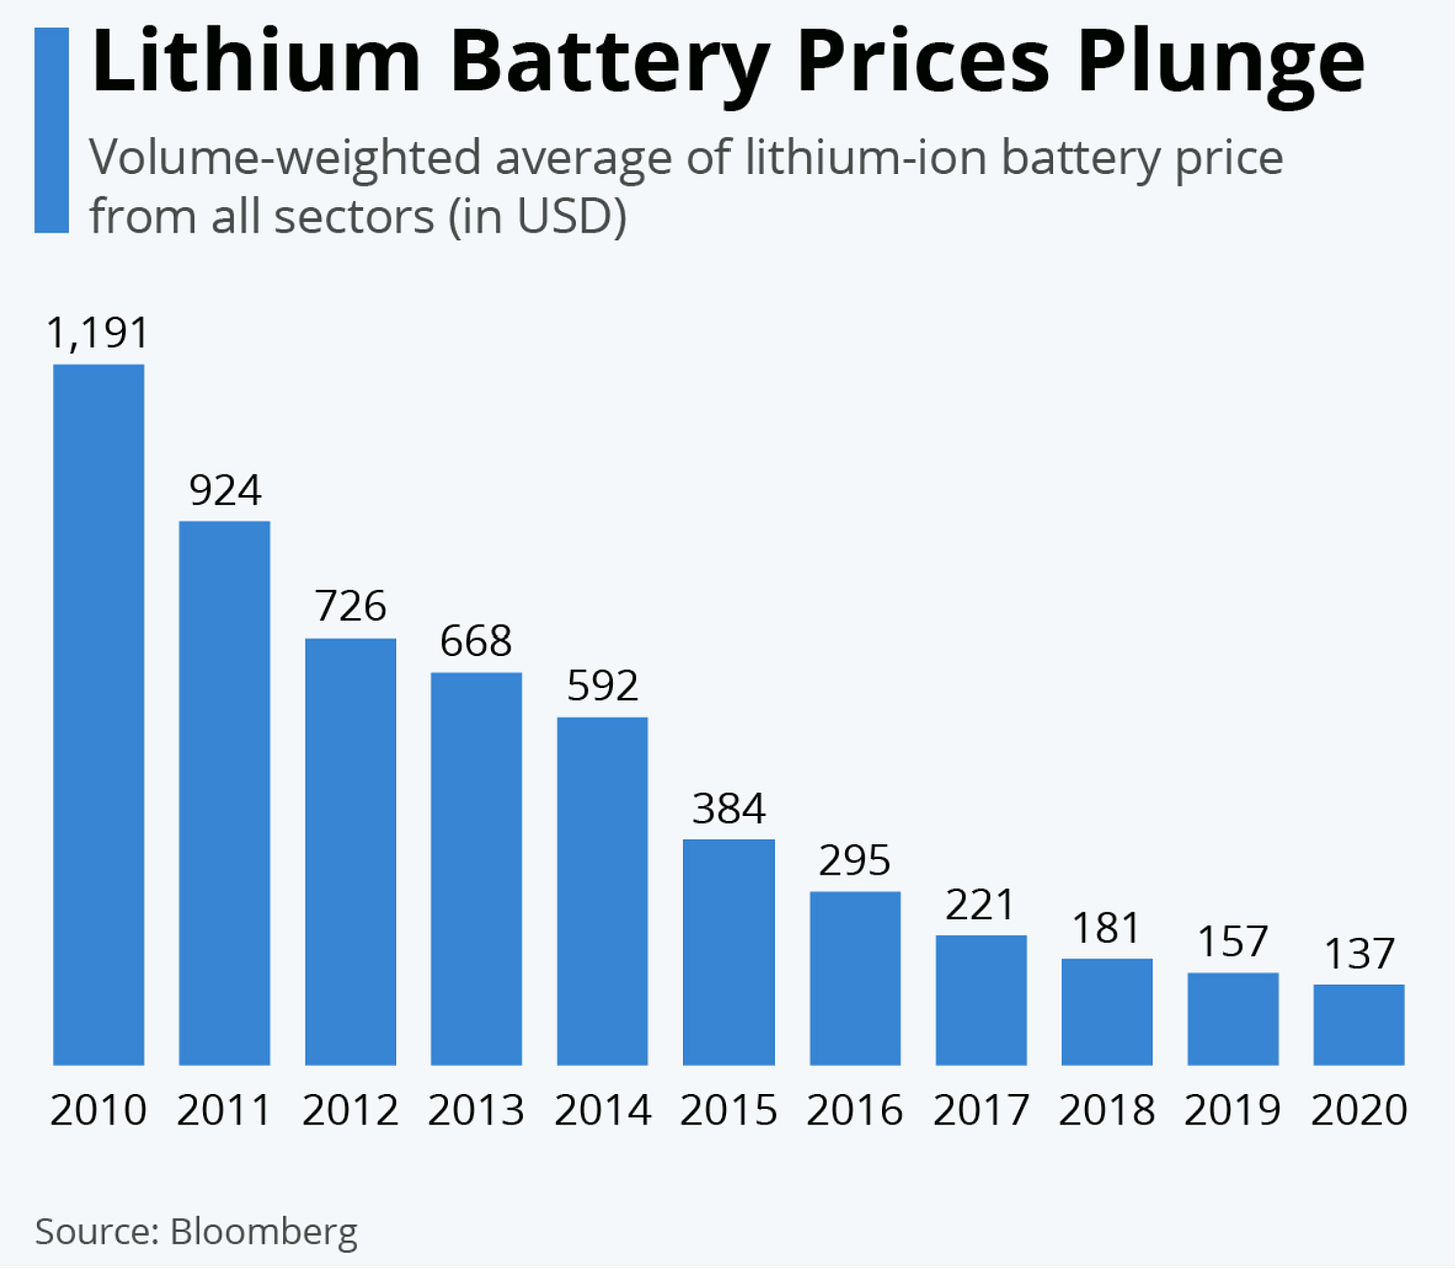
One way to increase your self consumption is to buy battery or storage. Buying storage allows you to have more control over when you want to use the energy generated by your solar panels not only during night/peak hours but also when the grid is out (note: if you don’t have battery and the grid is out, you won’t have electricity either even if you have solar system). An average solar battery is 10 KWh in size (also what Enphase suggested me, see above) and depending on your personal context (do you just want to use when the grid is down for an hour or two? Or do you want to be completely off-the-grid?), you may need to buy multiple batteries. As I have shared last month on my Tesla Deep Dive, the cost of lithium-ion batteries have plummeted over the last decade.
It’s not just batteries, Solar’s LCOE or Levelized Cost of Energy, which is a measure of the average net present cost of electricity generation for a generator over its lifetime, has declined almost ~90% over the last decade or so.

While the aforementioned graph is one of the favorite charts of Solar industry, it does have limitations. Perhaps one of the biggest shortcomings for LCOE calculation is it does not account for the storage costs that are often required to fully benefit from Solar. Matt Loszak wrote a pretty intriguing thread explaining this limitation:
Millions of people mistakenly believe that Solar is now our cheapest option for powering the grid. What's misleading them? A sneaky metric known as LCOE.
Levelized Cost of Energy, or LCOE, is the total cost of a project, divided by the total energy that it produces in its lifetime. If you build a field of low-cost solar panels that produce a lot of energy over their lifetime, it's a low LCOE and a great investment, right?
What LCOE ignores, is the cost of unreliability. While it might selfishly be a good investment for a solar developer, it could be a terrible investment for the grid, and society at large.
Imagine we were talking about two internet providers: Sun Internet Co, and Atom Internet Co. Sun Co charges $1/GB, while Atom Co charges $5/GB. But Sun Co only works from 9am–5pm, and its speed drops by 80-90% on cloudy days.
Would you opt to save the $4/GB difference, and deal with the inconveniences of Sun Co? Maybe you'd buy an extra hard drive, and download a ton of Netflix shows during the day, to watch later at night. But hard drives also cost money.
The bigger challenge is the 90% speed drop on cloudy days. The internet would randomly become unusable, sometimes for days on end. If you lived in a very sunny area, this might be a small issue. But for most populated places on Earth, there's often unpredictable cloud cover.
To deal with it, you'd pre-download even more content, and buy more hard drives. The hardest part would be the randomness of the outages. Should you download content to last 1 cloudy day? 5? 10? That's a lot of extra data ($)and storage() that might end up wasted…
There are no guarantees - the safer you want to be, the more expensive this game would become. Very quickly that $1 / GB price tag on Sun Internet Co would look a lot more like $6–10 / GB.
In energy planning, the worst case isn't that you forget to download your fav show and feel bored at night. Rather, it's blackouts, causing shortages of water, food, and heating or cooling.
Oil and gas companies love renewables. Today, renewables are always backed 1:1 by oil-and-gas based generators, to fill gaps. In the future, solar purists propose mega storage, and overbuilding (extra panels) as the solution. These extra costs aren't factored into LCOE.
When the cost of unreliability is considered, solar no longer looks like a silver bullet.
This isn't to say that solar is bad - it will still play a role in our future grids.
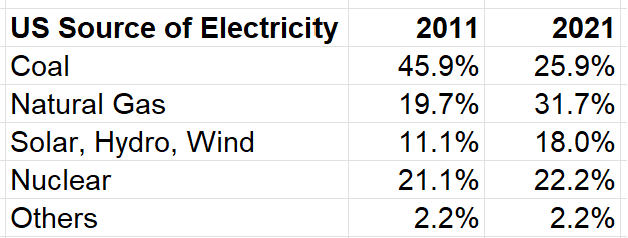
In addition to Matt’s concerns, one thing I would like to add here is that the renewables (solar, hydro, and wind) contribution to overall electricity generation mix itself can have profound impact on the overall stability of the grid. For example, renewables contributed 18% of overall electricity generation in 2021 (vs 11% in 2011); Solar was just 2.7% of overall source of electricity in the US in 2021. Due to material inclement weather or whatever, let’s say if solar’s contribution to grid goes down by ~10%, it may be quite manageable today. But imagine if solar becomes 50-60% of the overall electricity generation in the US in some distant future, a 10% downward swing in electricity generation would have a materially negative impact on the stability of the overall grid.
Despite such a material price decline in solar prices over the last decade, Enphase showed me that it would cost me ~$41k to install solar panels in my place. If I add battery as well (e.g. 10 KWh), the cost would go up to ~$55k. Assuming I would pay for these in cash, my payback period would be ~16 years for Solar only and almost ~20 years for Solar & Battery. The payback period takes into account of the 30% Federal tax incentives (more on this later). Enphase also shows me installing solar and battery would reduce my recurring electricity bill by ~70% over 25-year period. If you add the initial installation costs and the total electricity bill after installing solar and battery, Enphase shows you are going to save ~$17k over 25-year period.
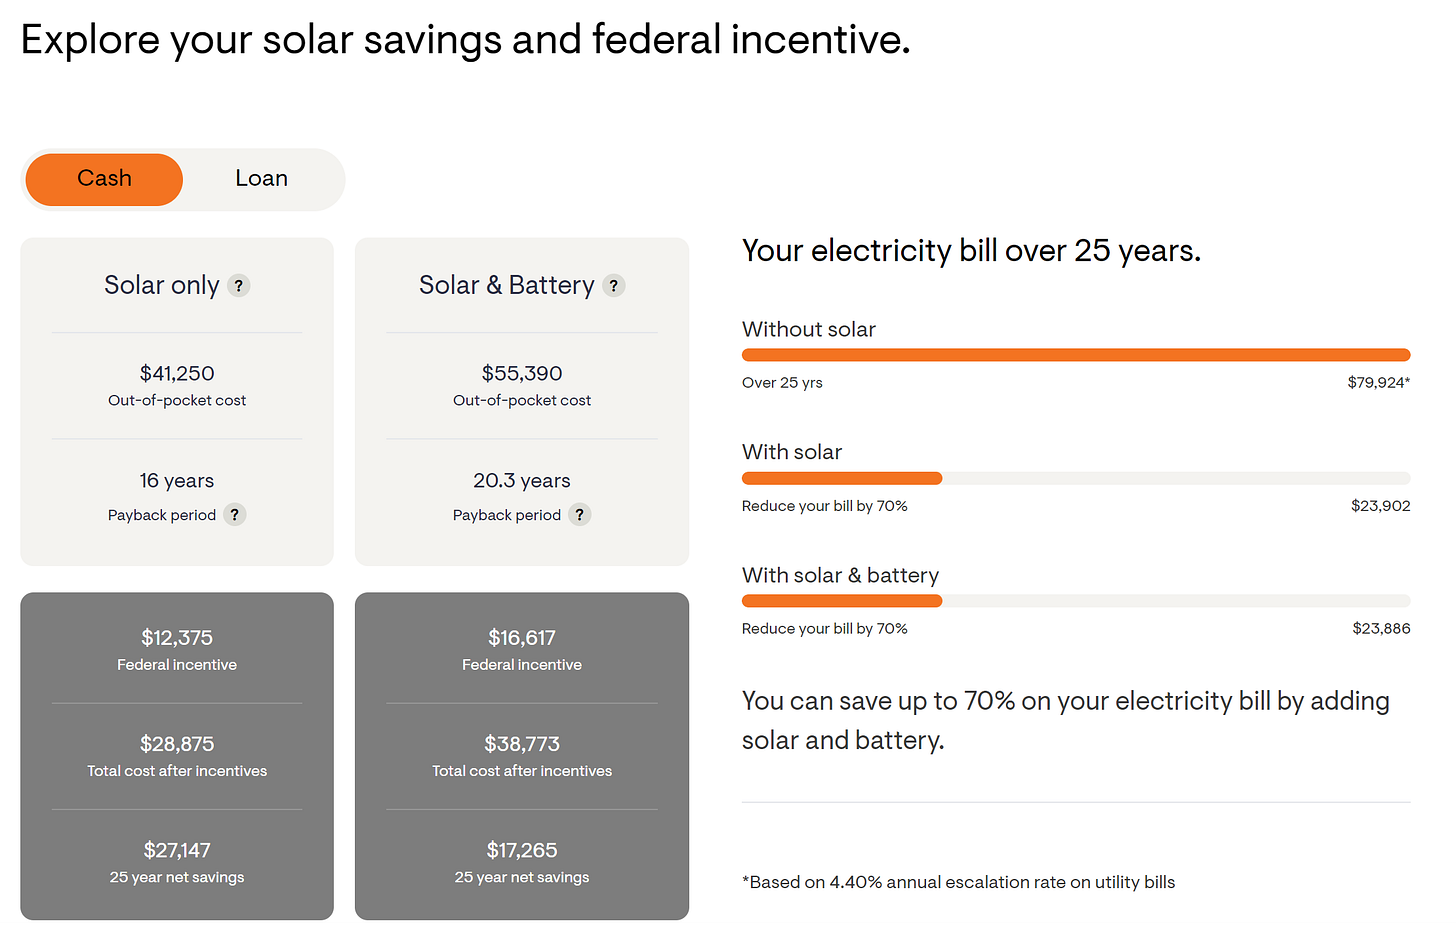
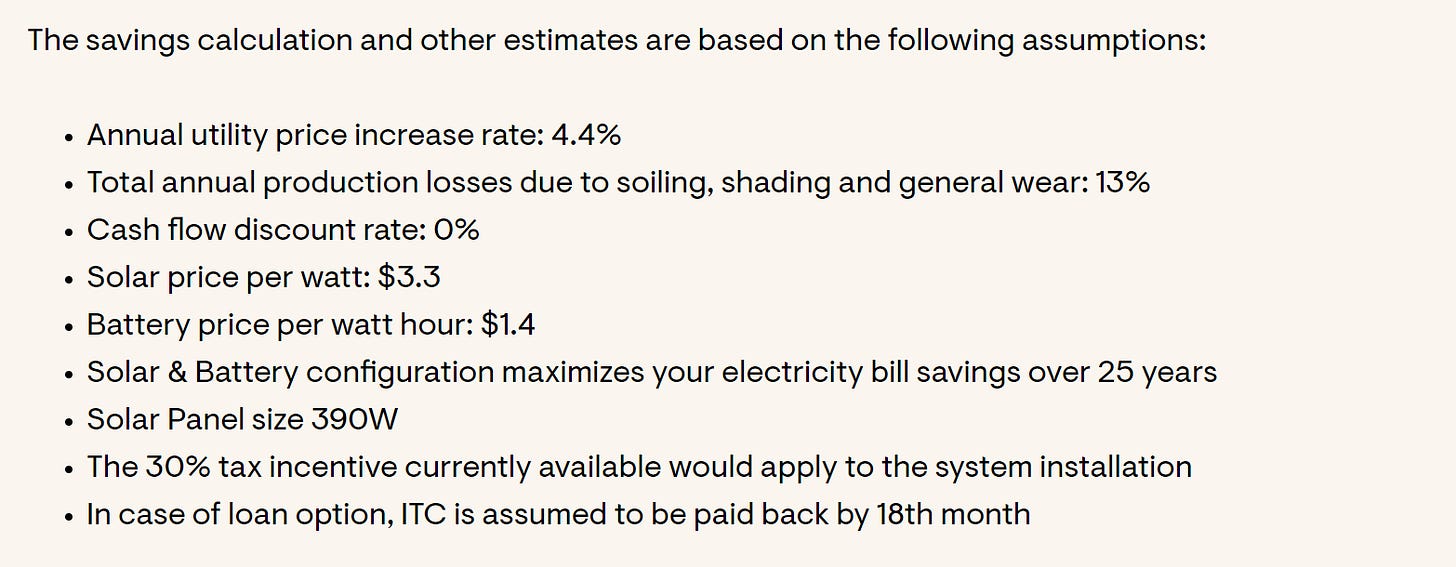
If you notice carefully, one of the assumptions made in that calculation by Enphase is they expect utility bills to increase by 4.4% rate per year. That seems to be bit of an aggressive assumption to me given average residential price for electricity increased by 2.2% rate per year over the last 10 years. Even during 2003-2012 period, electricity price increased by 3.5% per year. So, assuming 4.4% growth rate would imply a material acceleration of price increases compared to what we have seen over the last two decades. That doesn’t mean it’s impossible of course; just it seems a bit aggressive which Enphase is, of course, incentivized to assume to show the appeal of Solar to potential customers. Rising utility bills is an important driver to create demand for solar.
What if you don’t have cash to pay for solar? You can take loans. Enphase showed an option for 20-year loan with 9.49% borrowing rate (for >720 credit score) which would lead to ~$270 for just solar panels and ~$360 for both solar and battery. If you annualize the monthly payment and add the reduced electricity bill after installing solar and battery, Enphase showed me it would actually lead to ~$30k higher total expenditure on electricity for me over 25-year period (again, assuming $150 monthly electricity bill today growing at 4.4% CAGR). While Enphase showed me a pretty high interest rate loan option, EnergySage reported that the median interest rate for solar loans increased from 2.99% in 2H’22 to 4.99% in 1H’23.
As you can probably tell by now, lower interest rate is another very important driver for solar, especially given majority of solar installation is financed by loans. As interest rates keep rising, it inherently dampens demand for solar as for many people the choice may not make economic sense.
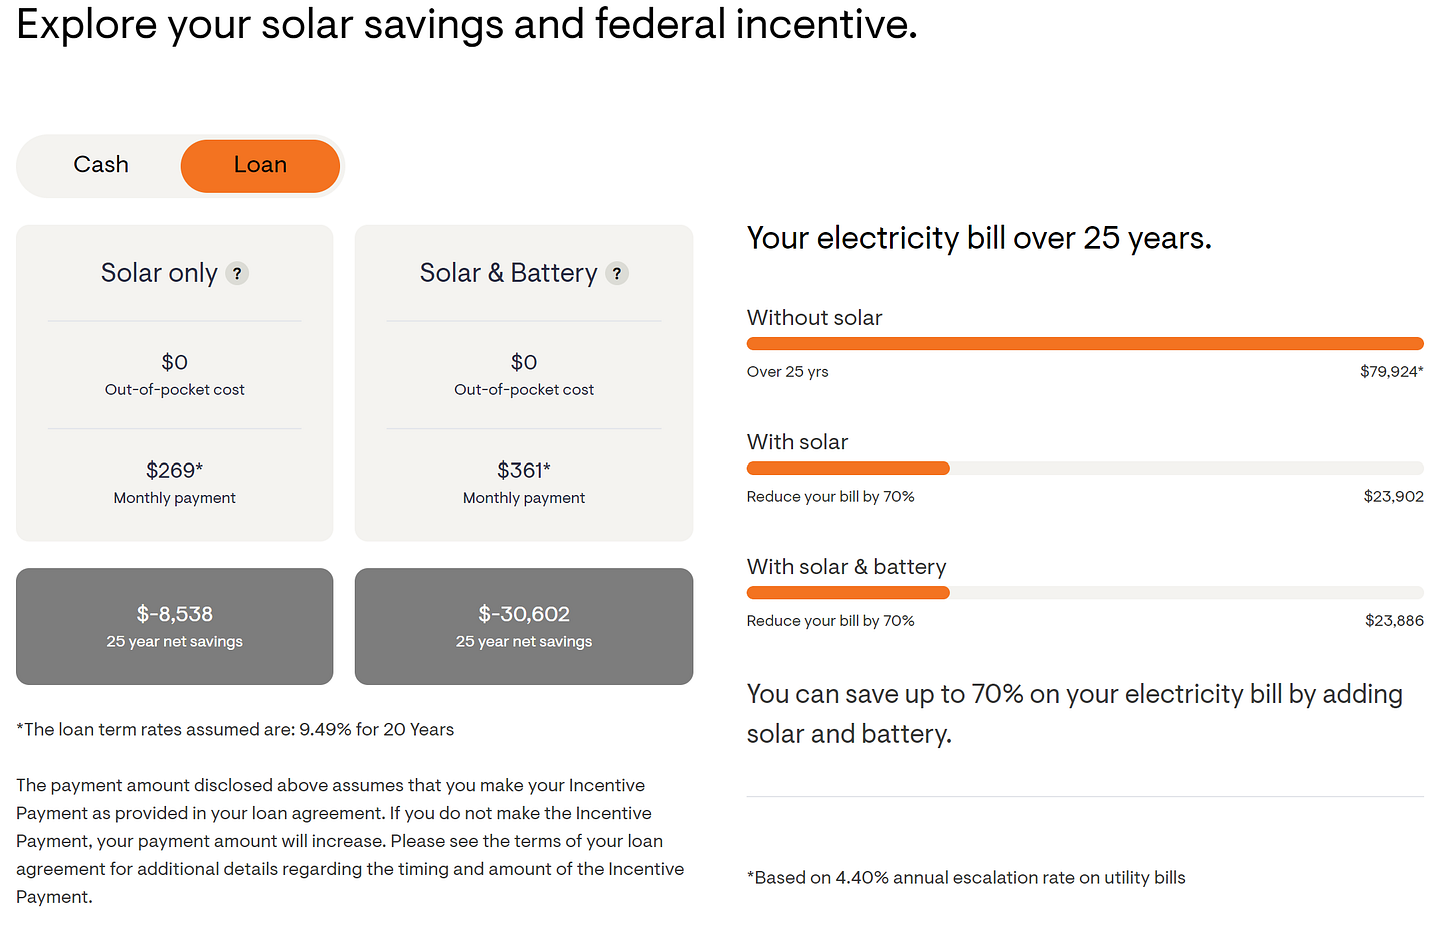
Even for cash financing for solar, while Enphase showed me some savings if I opted for solar, the fact is it didn’t account for the opportunity cost of capital. When I looked carefully the assumptions Enphase made to calculate those savings, I noticed cash flow discount rate is assumed to be zero.
However, given how much costs have come down for solar, it is tempting to infer that as costs continue to come down over time, opting for Solar may make much more economic sense. That optimism will likely have some hurdles to overcome. A few months ago, John Arnold explained that even though solar costs have precipitously fallen historically, the road ahead may be much more challenging:
…the story is more complicated, with 3 distinct phases.
Phase 1: Introduction, 2000-early 2010s. Sharp cost declines that happened as the industry went from near zero to commercial scale. Significant tech and manufacturing advancements, economies of scale, cost of capital declines, new vendor and developer competition
Phase 2: Growth, early 2010s-2019. Smaller cost declines as industry matures. Technology improvements slow, gains from economies of scale and vendor competition plateau, credit spreads tighten, but labor costs increase.
Phase 3: Maturity, 2020-now. Costs increase as the deflationary aspects either plateau or have become a small % of total costs. Technology advancements start hitting against physical constraints, materials and labor costs increase, top tier acreage near demand centers is already developed, interconnection delays, interest rate increase severely raises cost of capital, disruption from tariffs on Chinese solar panels, intense vendor competition eases, more accurate pricing of congestion risk, wind turbine manufacturers reprice after losing billions and, also, COVID supply chain interruptions. The NYT writes that, "in 2023, costs rose because of supply-chain problems, inflation and other issues," as if it's a one-time event this year that will quickly reverse. I worry this cost increase is more structural.
To flesh out Arnold’s concerns more clearly, let’s take a closer look at solar installation costs today. Solar panels (including warranties) are just ~20-25% of the overall installation costs. 10% of the costs is the inverters which is what Enphase primarily sells (more discussion on Enphase business later). Another 10% is racking, mounting etc. whereas a whopping ~55-60% of the overall cost is the installation itself which comprises of labor and wages, workers’ insurance, permitting fees, interconnection fees etc. (more discussion on overall costs here)
As Arnold alluded, the deflationary mix of the overall costs is already quite low and even if they keep declining over time, the inflationary mix (labor and wages) of the overall costs may make it challenging for the costs to experience material decline from current level.
Moreover, Solar’s supply chain appears to be quite fragile in the context of current geopolitics. IEA reported in 2022 that “China’s share in all the key manufacturing stages of solar panels exceeds 80%… and for key elements including polysilicon and wafers, this is set to rise to more than 95% in the coming years, based on current manufacturing capacity under construction.”
From US and many other developed market’s perspective, it is perhaps not the most prudent decision to be over reliant on an energy source whose overall supply chain is utterly dominated by China. While manufacturing solar panels can likely be replicated by western countries, it will most certainly take some time to scale their manufacturing. If solar becomes larger part of the overall energy mix over time, that may become increasingly even more relevant concern.
Nevertheless, the fact remains solar investment has been increasing at a rapid pace almost across the world. Run-rate solar investment in 2Q’23 was near $500 Bn. In 2013, total investment in oil production was $636 Bn whereas solar was just $127 Bn. But in 2023, total investment in Solar is expected to be $382 Bn, surpassing $371 Bn of investment in oil production. Apart from low interest rates in the past decade and relatively higher utility rates in recent years, the other two primary drivers for Solar are increased awareness and concerns around climate change, and government regulations.

NEI estimates that during 2011-2016 period, “renewable energy received more than three times as much help in federal incentives as oil, natural gas, coal, and nuclear combined, and 27 times as much as nuclear energy.”
In more recent time, The Inflation Reduction Act of 2022 (IRA) offered $127 billion in clean electricity tax credits to mostly Solar and Wind Energy industry. The most relevant of tax incentives for solar industry is Solar Investment Tax Credit or ITC. Residential homeowners who install solar energy systems between January 1, 2022 through the end of 2032 will receive a tax credit of 30% of the cost from their federal income taxes.
Following 2032, the residential ITC will gradually phase out to 26% in 2033, 22% in 2034, and will end in 2035.
Even beyond ITC, there are a few states in the US that lets homeowners sell one Solar renewable energy certificate (SERC) for every megawatt hour (MWh) or 1,000 KWh of electricity generated by their solar system. The value of each SERC varies by state (can be ~$5 to a couple hundred dollars). SERCs exist to help utilities meet renewable portfolio standards (RPS) that require utilities to produce a specific percentage of their electricity from renewable energy sources.
While much of these regulations are quite conducive to Solar industry, there are some potentially negative developments in California, a state that contributed ~20% of Enphase’s total revenue in 2022. California used to have Net Energy Metering Policy (NEM) which allowed a billing system between utility providers and customers generating their own power through solar. Under NEM 2.0, self-generators could earn credits for the excess electricity their system provides to the grid. This export rate for solar energy was based on a tiered rate structure that offered a single rate for excess energy exported to the grid, regardless of the time of day or day of the week. This meant that customers received the same credit for excess solar energy exported during peak, shoulder, or off-peak periods. With NEM 3.0, the export rate is now aligned with time-of-use (TOU) periods, offering higher credits for excess energy exported during peak periods and lower credits during off-peak periods. Enphase itself mentioned in their 10-K that following NEM 3.0 implementation, the average export rate in California is expected to be ~5-8 cents per KWh vs ~25-35 cents per KWh earlier. Given California is the largest solar market in the US, this can dampen the demand for solar, especially in the current high interest rate environment.
Enphase, however, sounds optimistic that this regulatory change may turn out to be a boon for them as solar households in California would be incentivized to add storage to their solar system to increase self-consumption during peak hours when rates are highest and reduce low-value exports to the grid by using battery storage. SunPower (one of the leading solar installers in the US) mentioned the company saw battery attachment rates of 26%, 32%, and 47% in the first three weeks in California right after NEM 3.0 came into effect in April 2023. SunPower also mentioned they think battery attachment rate could ultimately exceed 20%. For context, the attachment rate of battery in solar system is ~80% in Germany, Europe’s largest solar market. Hence, 20% could prove to be conservative attachment rate in the long term.
Now that we have a good context for Solar industry, let’s delve into the details of Enphase’s business.
Here’s the outline for the rest of this Deep Dive:
Section 2 Enphase Business Overview: I segmented Enphase’s business in three categories: microinverters, storage, and miscellaneous/other. The overall economics and Serviceable Addressable Market (SAM) for Enphase is also discussed in this section.
Section 3 Competitive Dynamics: I dissected the overall Solar value chain into three broad segments: manufacturers, distributors/installers, and companies such as Enphase who sit at the middle between the two. I discussed why margins are pretty think in other parts of the Solar value chain, why Enphase enjoys relatively attractive margins, and some potential threats to long-term margins.
Section 4 Management and Incentives: I briefly discussed Enphase management’s capital allocation philosophy and management incentive structure in this section.
Section 5 Model Assumptions/Valuation: Model/implied expectations are analyzed here.
Section 6 Final Words: Concluding remarks on Enphase, and disclosure/discussion of my overall portfolio.