Energy's Moment
S&P 500 is down almost 7% Year-to-date. As you can see below, Energy sector ETF has been by far the best performing so far in 2026 with ~40% return YTD. Tech, on the other hand, was close to the other extreme as it is down ~10% YTD.

In fact, John Arnold recently made a tongue-in-cheek observation: if you had half of your portfolio in tech and the other half in energy ETF since 2020, your portfolio would have pretty good return every year. Don’t be too excited though as this reply showed that this strategy would not yield such halcyon results from 1999 to 2020! As they say, you can prove almost anything you want in investing if you just get to pick and choose the start and end dates. Alas, the world is far more complicated and unpredictable to have easy fixes!

MBI Deep Dives doesn’t really follow energy markets closely and as I have mentioned earlier, I don’t have anything intelligent to say either about oil price or about the ongoing war in Iran even though these will obviously have an effect on the companies I personally own. Even though I don’t have much of an opinion how these events will unfold, during the weekend I did go through Michael Cembalest’s recent piece: “Pandora’s Bog: the global energy shock of 2026”. It’s a good read, so let me share a couple of my highlights from the piece.
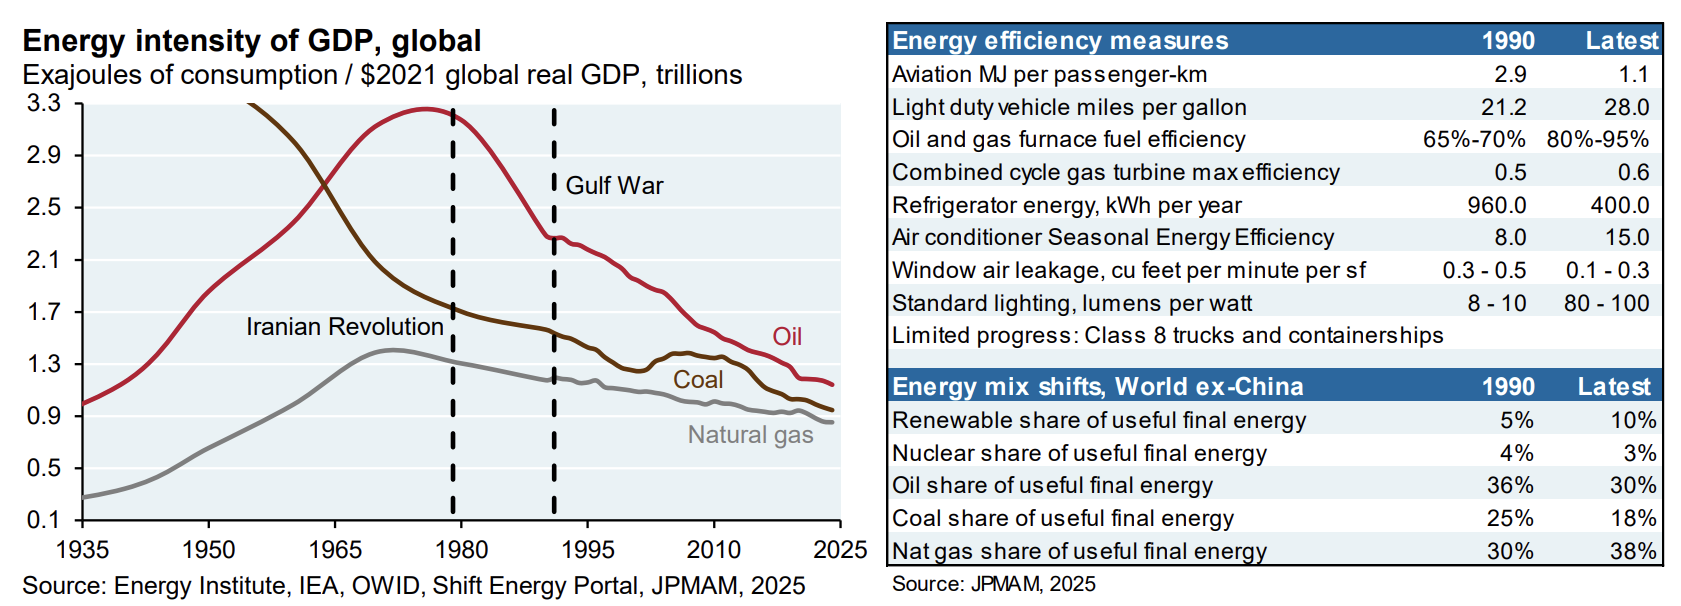
Cembalest started the piece with the good news:
“…the oil intensity of global GDP has plummeted since its 1970’s peak and is only half the level it was at the time of the Gulf War in 1990. Even the natural gas intensity of GDP has declined since 1980 despite natural gas consumption tripling since then.”
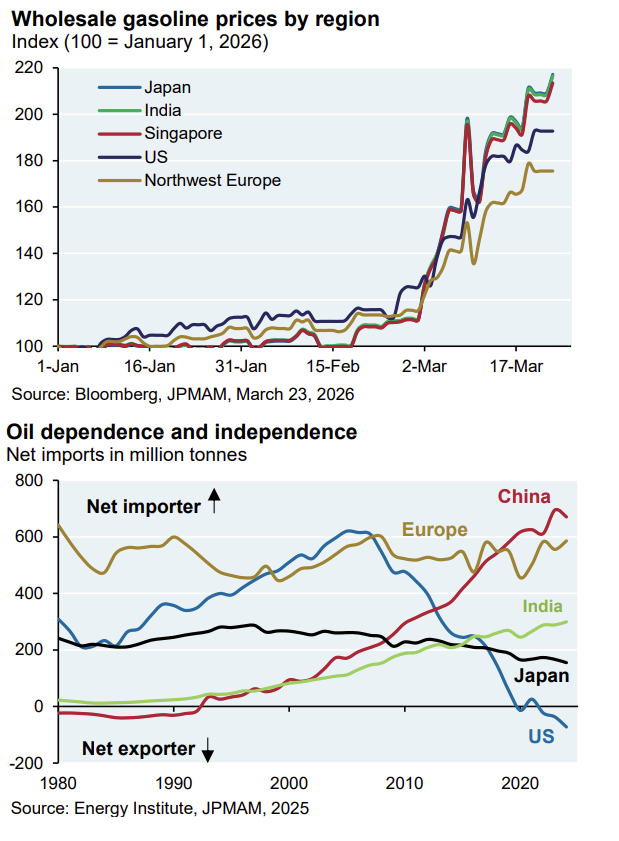
The bad news is “commodity prices are often set on the margin” and given commodities such as oil being a global market, the pricing trend can look remarkably similar across the world regardless of whether you are a net importer or net exporter of oil. In fact, let me highlight one of the things that I had to update after reading this report. Given that I am a tourist here, I had this naive assumption that since the US has now become a net oil exporter and China remains heavily dependent on imported oil, any oil shock would be net negative for China far more than it would affect the US.
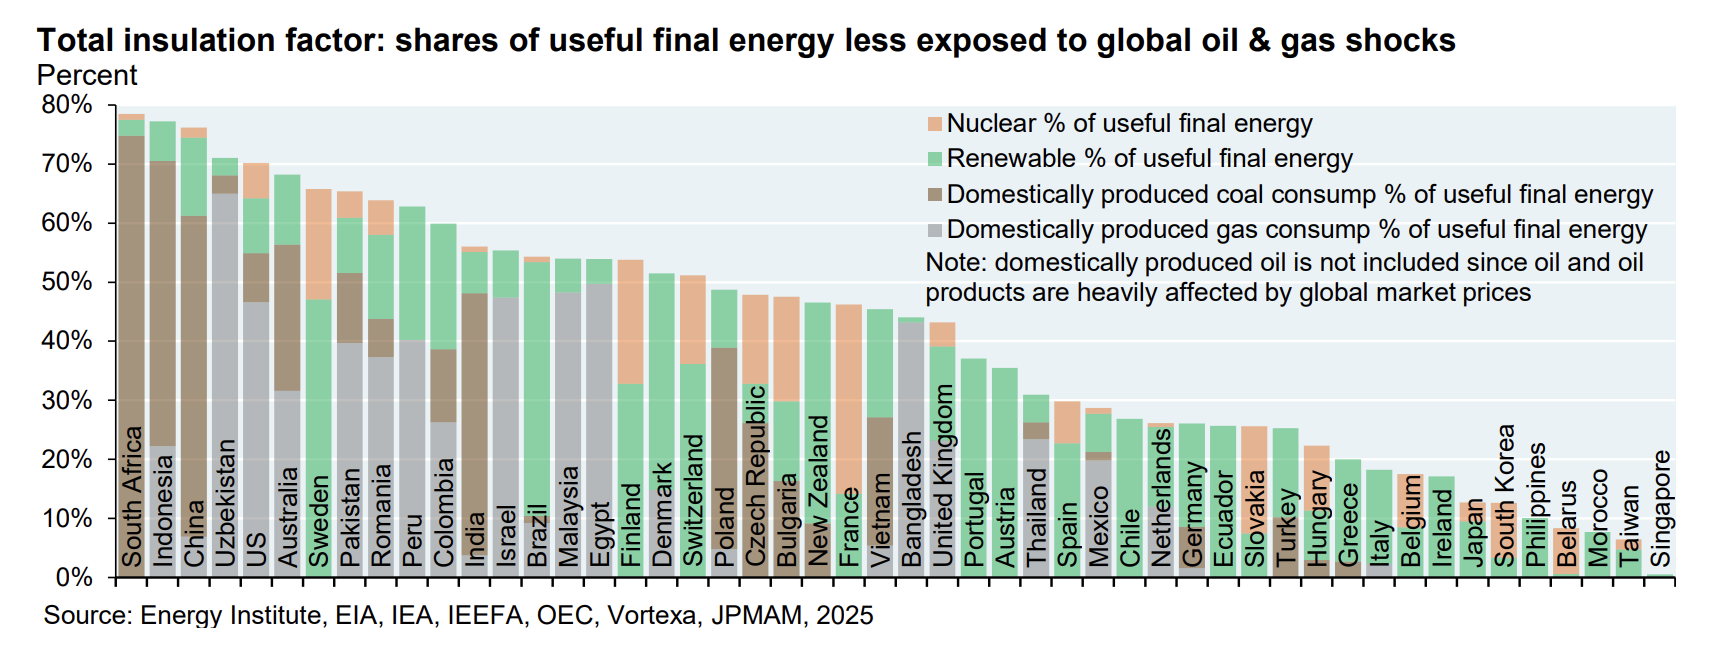
So, it was surprising for me when I noticed that China was actually ahead of the US in terms of “total insulation factor” when it comes to global oil & gas shocks. The "total insulation factor" indicates the share of a country's useful final energy that is less exposed to global oil and gas shocks. JPM calculated it by adding together a country's reliance on four specific energy sources: domestically produced gas, domestically produced coal, nuclear power, renewables (such as biofuel, hydro, wind, solar, and biomass). China has a total insulation factor of 76%, while the US has a total insulation factor of 70%. China scores higher primarily because of its massive reliance on domestic coal (54% of useful final energy), which accounts for a larger share of its energy mix than the US's primary domestic buffer: natural gas (44.5% of useful final energy).
Even though China is the world’s largest oil importer nation, oil imports make up 13% of China's primary energy consumption. When you combine all oil consumption and imported gas, it only accounts for 20% of China's primary energy. None of these may be news to anyone following energy markets closely, but since like me, I suspect most of my readers are likely to be more ardent followers of technology than energy sector, I wanted to share this potential blind spots that I personally had until I read this research report.
In addition to “Daily Dose” (yes, DAILY) like this, MBI Deep Dives publishes one Deep Dive on a publicly listed company every month. You can find all the 67 Deep Dives here.
Current Portfolio:
Please note that these are NOT my recommendation to buy/sell these securities, but just disclosure from my end so that you can assess potential biases that I may have because of my own personal portfolio holdings. Always consider my write-up my personal investing journal and never forget my objectives, risk tolerance, and constraints may have no resemblance to yours.
My current portfolio is disclosed below: